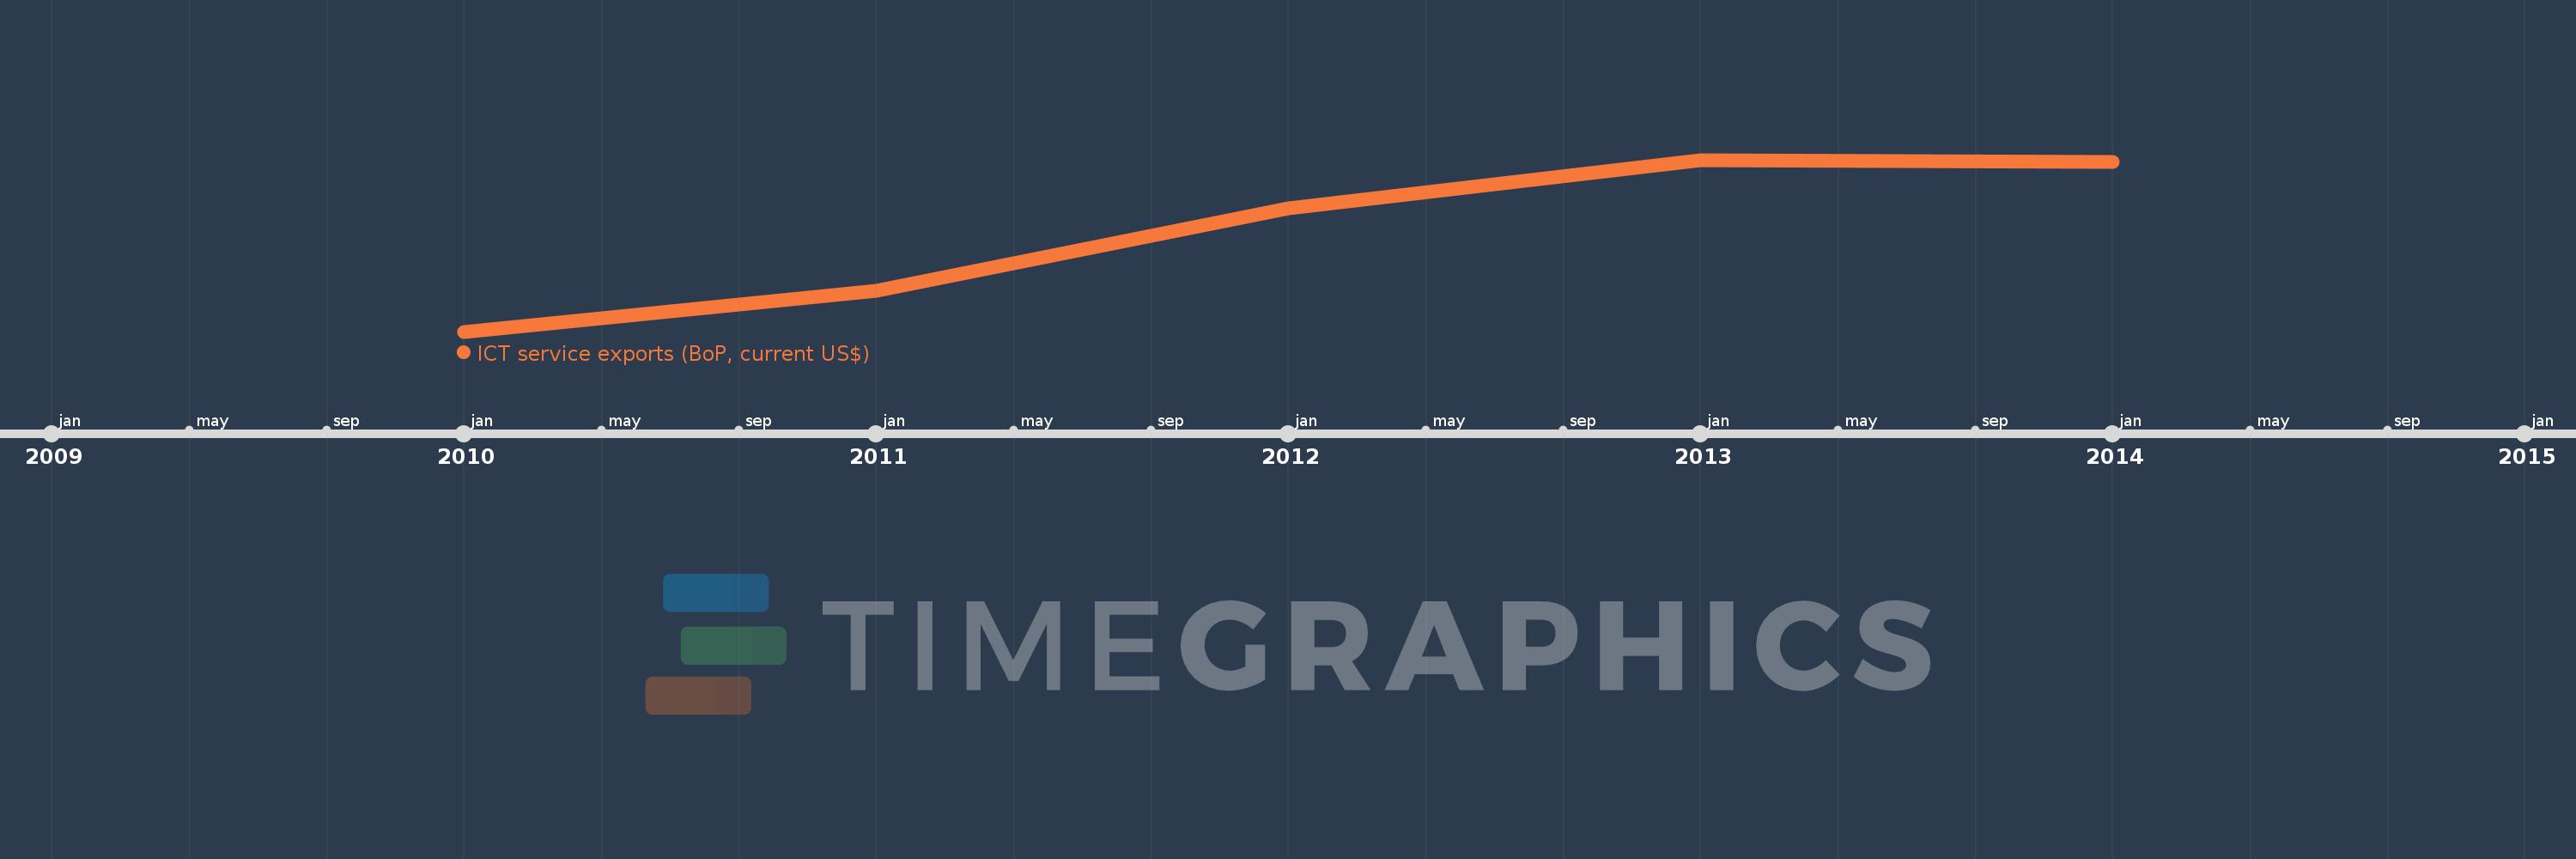
This timeline shows a graph from 2010 to 2014 of Sub-Saharan Africa (IDA & IBRD countries). No data until 2009. Number of actual observations by date: 5.
Source name:
World Development Indicators
Source organization:
International Monetary Fund, Balance of Payments Statistics Yearbook and data files.
Categories, topics:
Economy & Growth, Infrastructure, Trade
Last updated:
apr 23, 2017
Indicators value changes by year
Meaning:
7.111 bln
Minimum:
5.496 bln
jan 1, 2010
Maximum:
8.241 bln
jan 1, 2013
At the date of observation
Value
Absolute change
Change from the previous value
jan 1, 2010
5.496 bln
+5.496 bln
0.0%
jan 1, 2011
6.152 bln
+656.349 mln
11.94%
jan 1, 2012
7.459 bln
+1.307 bln
21.24%
jan 1, 2013
8.241 bln
+782.012 mln
10.48%
jan 1, 2014
8.205 bln
-35.65 mln
-0.43%
Ranking of countries by current statistics by years