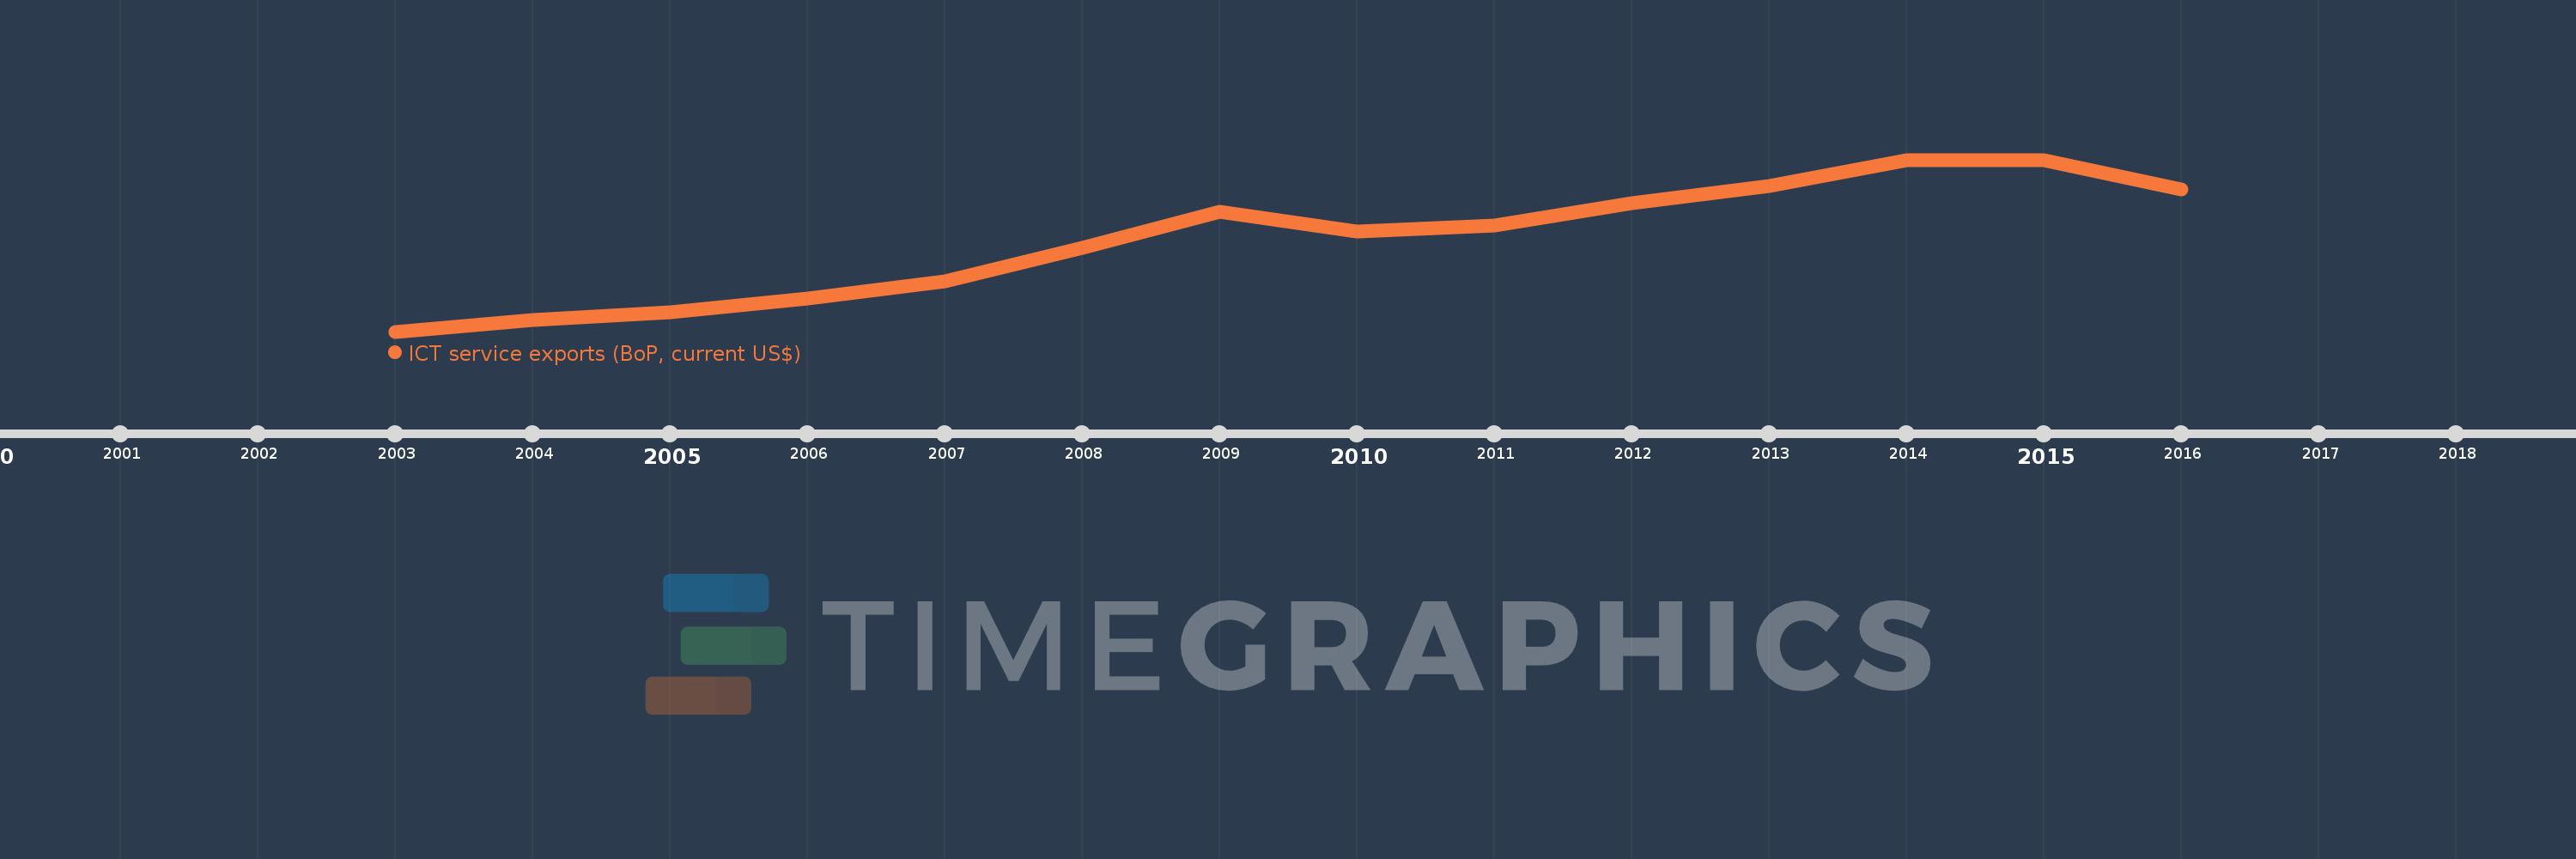
This timeline shows a graph from 2003 to 2016 of Europe & Central Asia (excluding high income). No data until 2002. Number of actual observations by date: 14.
Source name:
World Development Indicators
Source organization:
International Monetary Fund, Balance of Payments Statistics Yearbook and data files.
Categories, topics:
Economy & Growth, Infrastructure, Trade
Last updated:
apr 23, 2017
Indicators value changes by year
Meaning:
24.937 bln
Minimum:
5.067 bln
jan 1, 2003
Maximum:
42.333 bln
jan 1, 2014
At the date of observation
Value
Absolute change
Change from the previous value
jan 1, 2003
5.067 bln
+5.067 bln
0.0%
jan 1, 2004
7.509 bln
+2.442 bln
48.2%
jan 1, 2005
9.232 bln
+1.723 bln
22.94%
jan 1, 2006
12.268 bln
+3.036 bln
32.89%
jan 1, 2007
15.933 bln
+3.665 bln
29.87%
jan 1, 2008
23.165 bln
+7.232 bln
45.39%
jan 1, 2009
31.009 bln
+7.845 bln
33.86%
jan 1, 2010
26.735 bln
-4.274 bln
-13.78%
jan 1, 2011
28.156 bln
+1.421 bln
5.32%
jan 1, 2012
33.007 bln
+4.851 bln
17.23%
jan 1, 2013
36.698 bln
+3.69 bln
11.18%
jan 1, 2014
42.333 bln
+5.635 bln
15.36%
jan 1, 2015
42.163 bln
-170.129 mln
-0.4%
jan 1, 2016
35.837 bln
-6.326 bln
-15.0%
Ranking of countries by current statistics by years