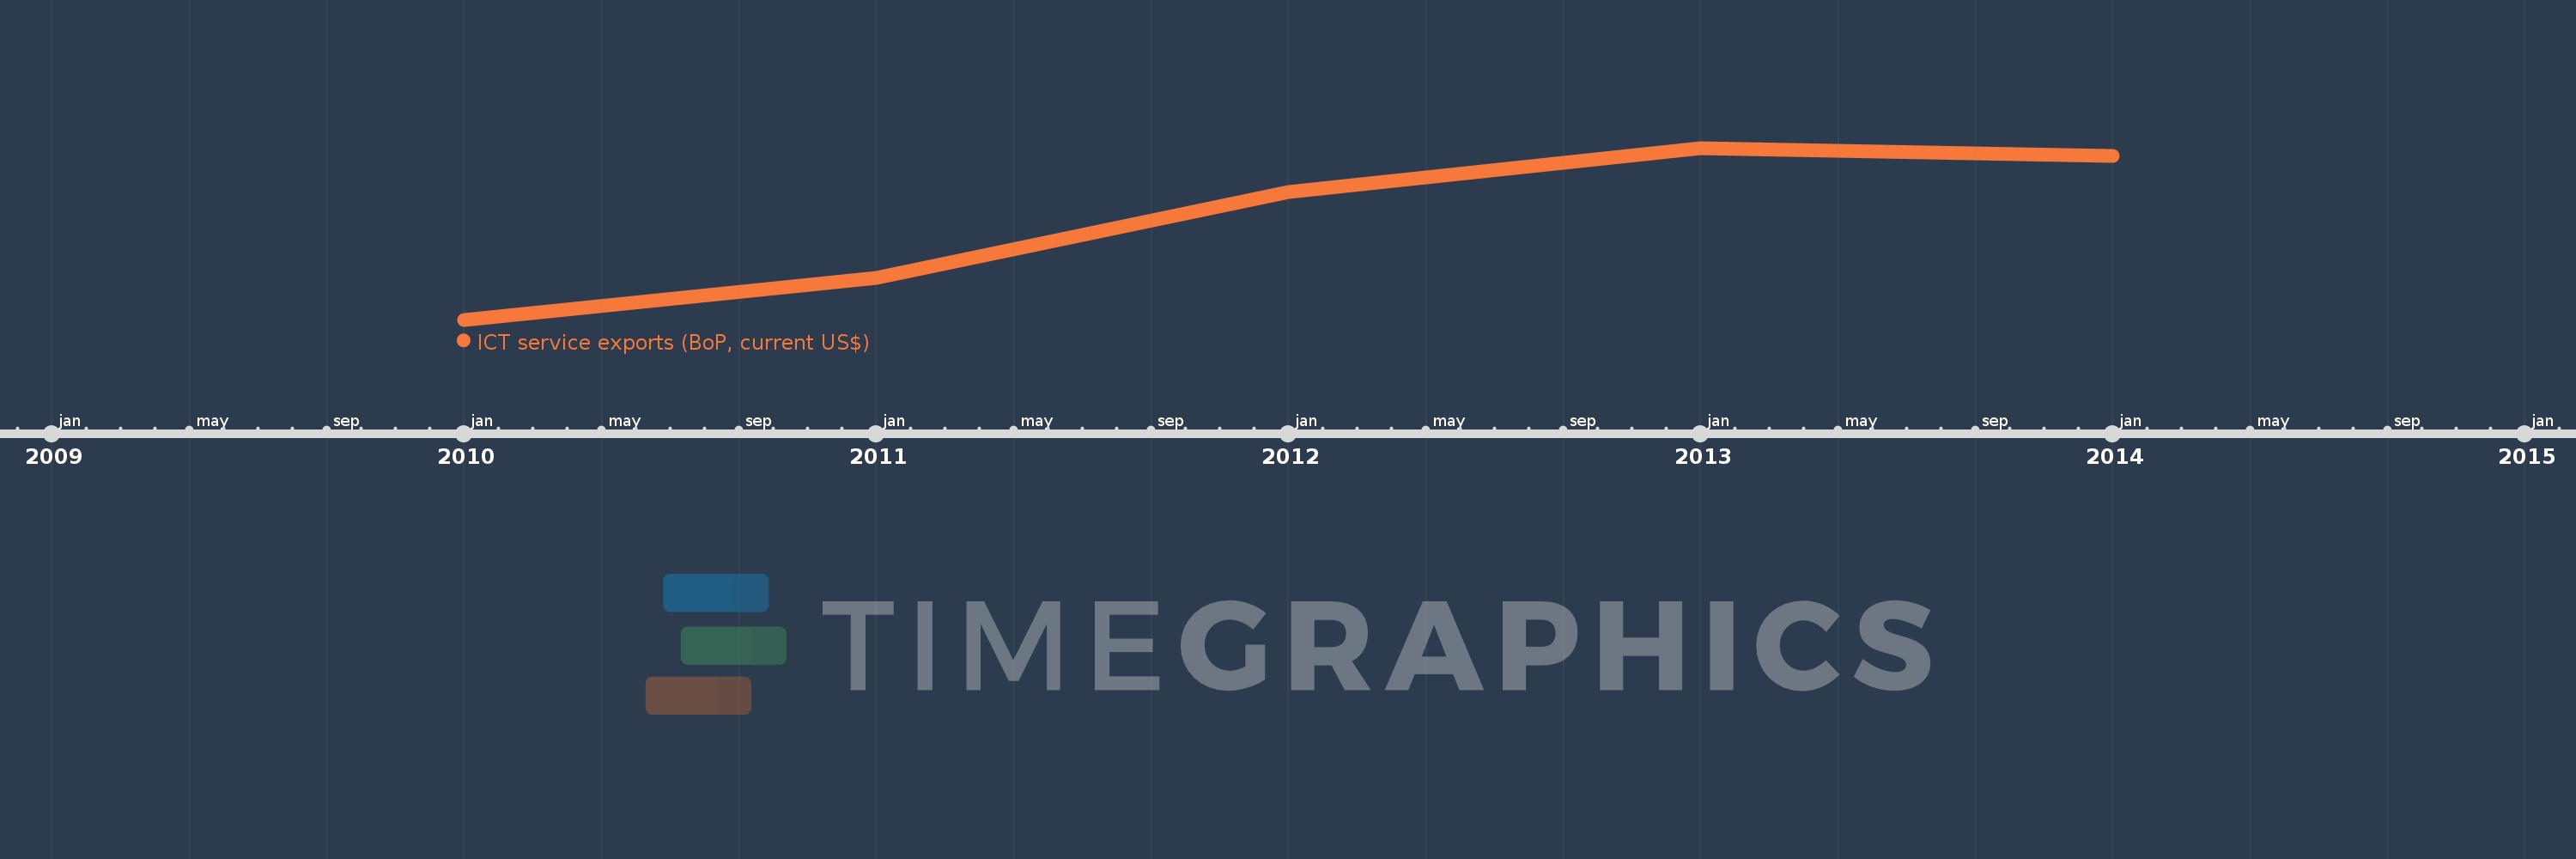
This timeline shows a graph from 2010 to 2014 of Sub-Saharan Africa (excluding high income). No data until 2009. Number of actual observations by date: 5.
Source name:
World Development Indicators
Source organization:
International Monetary Fund, Balance of Payments Statistics Yearbook and data files.
Categories, topics:
Economy & Growth, Infrastructure, Trade
Last updated:
apr 23, 2017
Indicators value changes by year
Meaning:
7.016 bln
Minimum:
5.478 bln
jan 1, 2010
Maximum:
8.093 bln
jan 1, 2013
At the date of observation
Value
Absolute change
Change from the previous value
jan 1, 2010
5.478 bln
+5.478 bln
0.0%
jan 1, 2011
6.119 bln
+641.356 mln
11.71%
jan 1, 2012
7.422 bln
+1.302 bln
21.28%
jan 1, 2013
8.093 bln
+671.644 mln
9.05%
jan 1, 2014
7.97 bln
-123.497 mln
-1.53%
Ranking of countries by current statistics by years