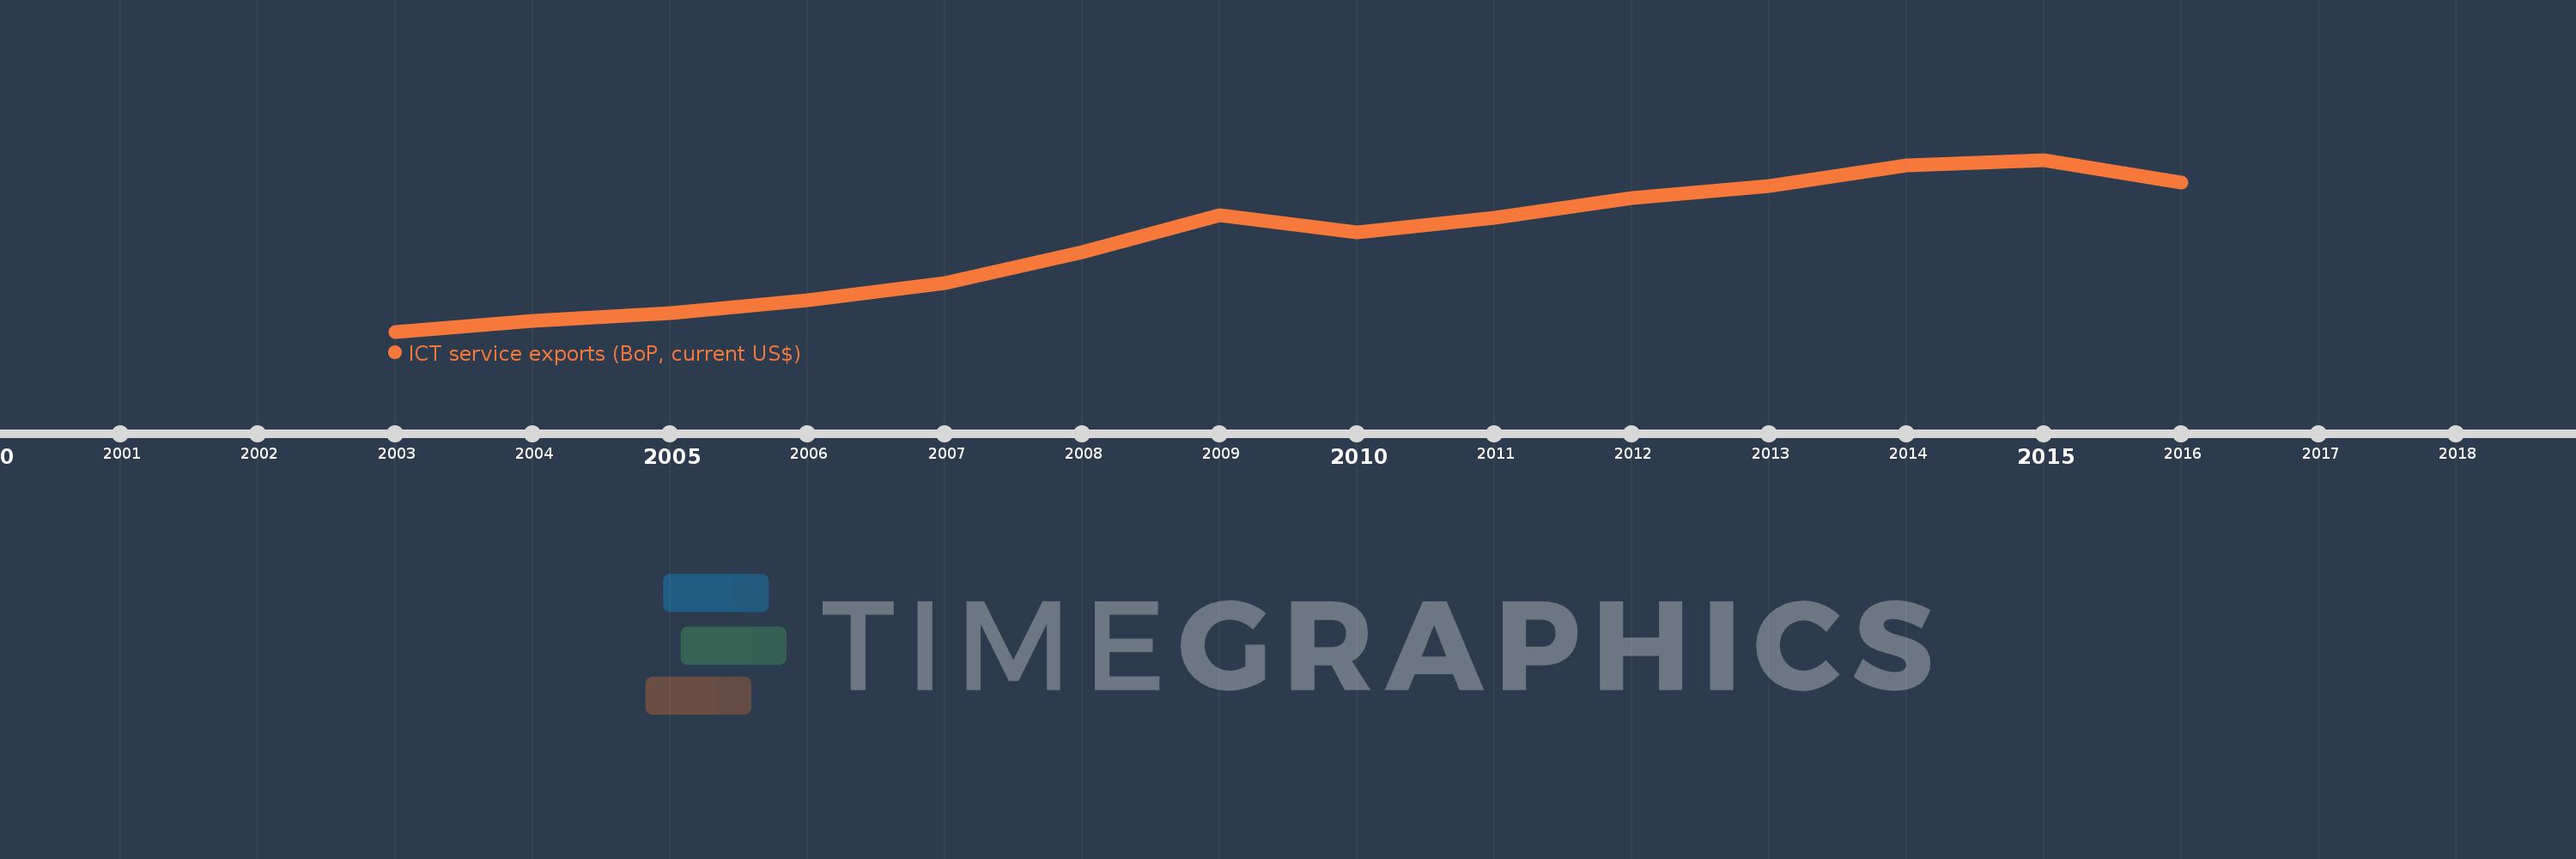
This timeline shows a graph from 2003 to 2016 of Europe & Central Asia (IDA & IBRD countries). No data until 2002. Number of actual observations by date: 14.
Source name:
World Development Indicators
Source organization:
International Monetary Fund, Balance of Payments Statistics Yearbook and data files.
Categories, topics:
Economy & Growth, Infrastructure, Trade
Last updated:
apr 23, 2017
Indicators value changes by year
Meaning:
34.683 bln
Minimum:
7.109 bln
jan 1, 2003
Maximum:
58.766 bln
jan 1, 2015
At the date of observation
Value
Absolute change
Change from the previous value
jan 1, 2003
7.109 bln
+7.109 bln
0.0%
jan 1, 2004
10.255 bln
+3.145 bln
44.24%
jan 1, 2005
12.598 bln
+2.344 bln
22.85%
jan 1, 2006
16.581 bln
+3.983 bln
31.62%
jan 1, 2007
21.64 bln
+5.059 bln
30.51%
jan 1, 2008
30.974 bln
+9.334 bln
43.13%
jan 1, 2009
42.149 bln
+11.176 bln
36.08%
jan 1, 2010
36.976 bln
-5.173 bln
-12.27%
jan 1, 2011
41.34 bln
+4.363 bln
11.8%
jan 1, 2012
47.174 bln
+5.834 bln
14.11%
jan 1, 2013
50.964 bln
+3.79 bln
8.03%
jan 1, 2014
57.093 bln
+6.13 bln
12.03%
jan 1, 2015
58.766 bln
+1.672 bln
2.93%
jan 1, 2016
51.947 bln
-6.819 bln
-11.6%
Ranking of countries by current statistics by years