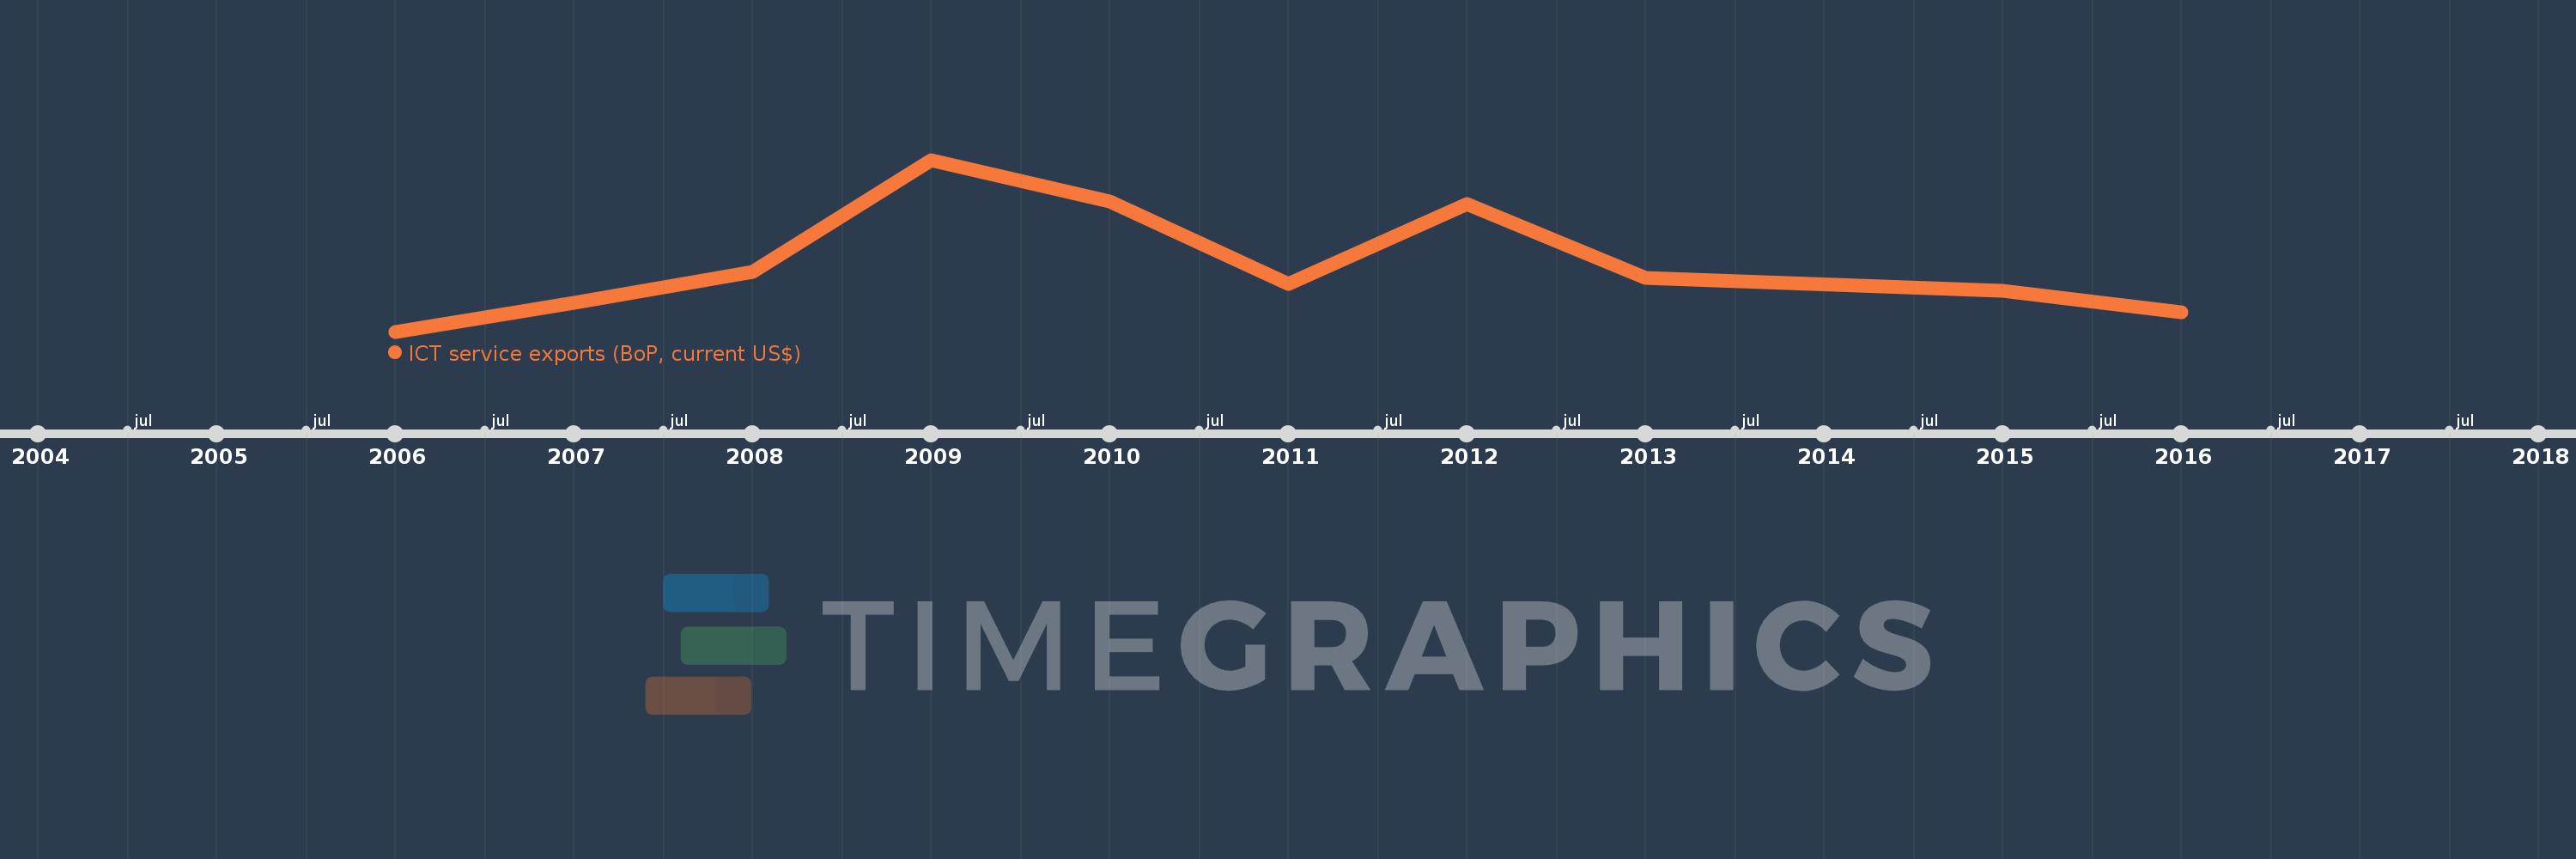
This timeline shows a graph from 2006 to 2016 of Middle East & North Africa (excluding high income). No data until 2005. Number of actual observations by date: 10.
Source name:
World Development Indicators
Source organization:
International Monetary Fund, Balance of Payments Statistics Yearbook and data files.
Categories, topics:
Economy & Growth, Infrastructure, Trade
Last updated:
apr 23, 2017
Indicators value changes by year
Meaning:
13.479 bln
Minimum:
9.472 bln
jan 1, 2006
Maximum:
19.596 bln
jan 1, 2009
At the date of observation
Value
Absolute change
Change from the previous value
jan 1, 2006
9.472 bln
+9.472 bln
0.0%
jan 1, 2007
11.159 bln
+1.687 bln
17.81%
jan 1, 2008
13.008 bln
+1.849 bln
16.57%
jan 1, 2009
19.596 bln
+6.587 bln
50.64%
jan 1, 2010
17.152 bln
-2.444 bln
-12.47%
jan 1, 2011
12.276 bln
-4.875 bln
-28.42%
jan 1, 2012
16.993 bln
+4.717 bln
38.42%
jan 1, 2013
12.615 bln
-4.379 bln
-25.77%
jan 1, 2015
11.898 bln
-716.179 mln
-5.68%
jan 1, 2016
10.624 bln
-1.275 bln
-10.71%
Ranking of countries by current statistics by years