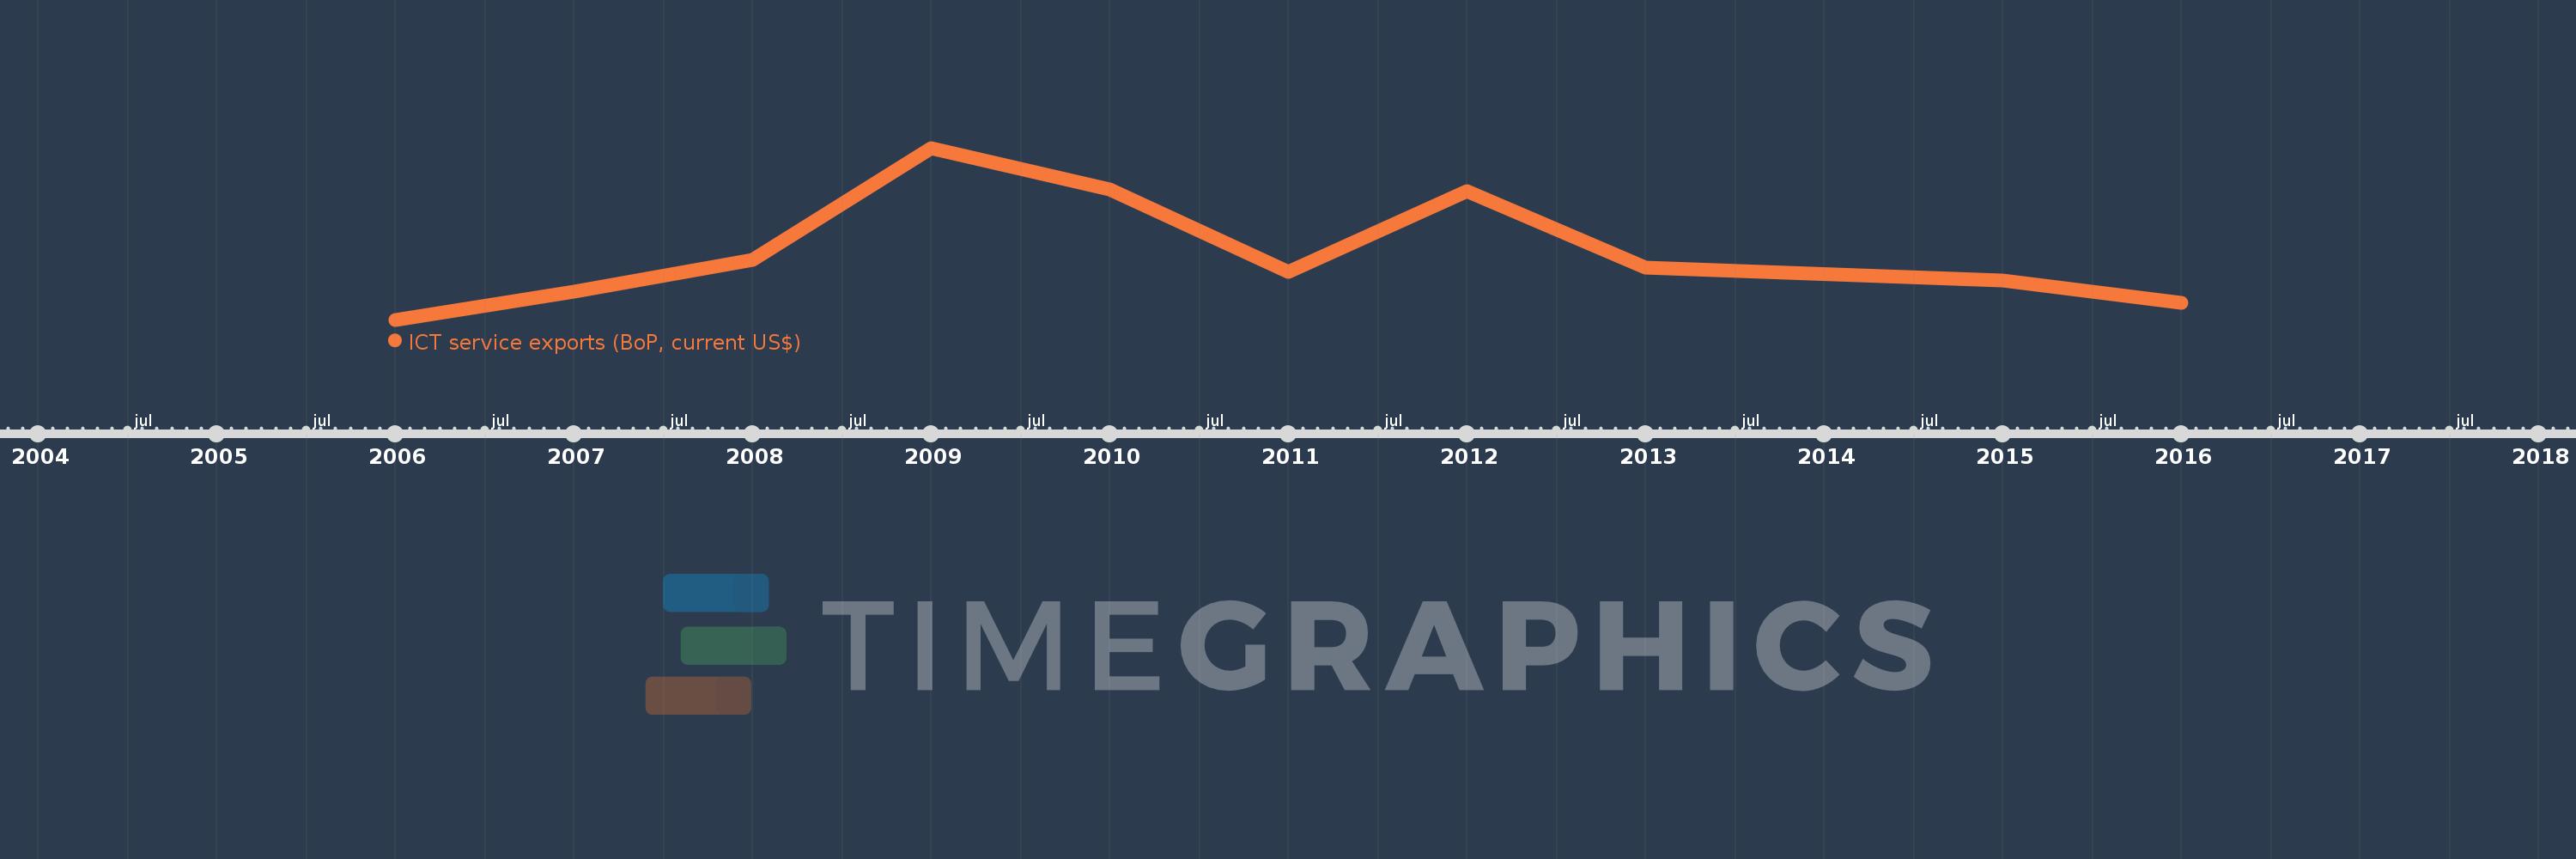
This timeline shows a graph from 2006 to 2016 of Middle East & North Africa (IDA & IBRD countries). No data until 2005. Number of actual observations by date: 10.
Source name:
World Development Indicators
Source organization:
International Monetary Fund, Balance of Payments Statistics Yearbook and data files.
Categories, topics:
Economy & Growth, Infrastructure, Trade
Last updated:
apr 23, 2017
Indicators value changes by year
Meaning:
13.363 bln
Minimum:
9.387 bln
jan 1, 2006
Maximum:
19.502 bln
jan 1, 2009
At the date of observation
Value
Absolute change
Change from the previous value
jan 1, 2006
9.387 bln
+9.387 bln
0.0%
jan 1, 2007
11.048 bln
+1.661 bln
17.69%
jan 1, 2008
12.911 bln
+1.863 bln
16.86%
jan 1, 2009
19.502 bln
+6.591 bln
51.05%
jan 1, 2010
17.062 bln
-2.441 bln
-12.51%
jan 1, 2011
12.226 bln
-4.835 bln
-28.34%
jan 1, 2012
16.952 bln
+4.725 bln
38.65%
jan 1, 2013
12.48 bln
-4.472 bln
-26.38%
jan 1, 2015
11.673 bln
-806.66 mln
-6.46%
jan 1, 2016
10.386 bln
-1.288 bln
-11.03%
Ranking of countries by current statistics by years