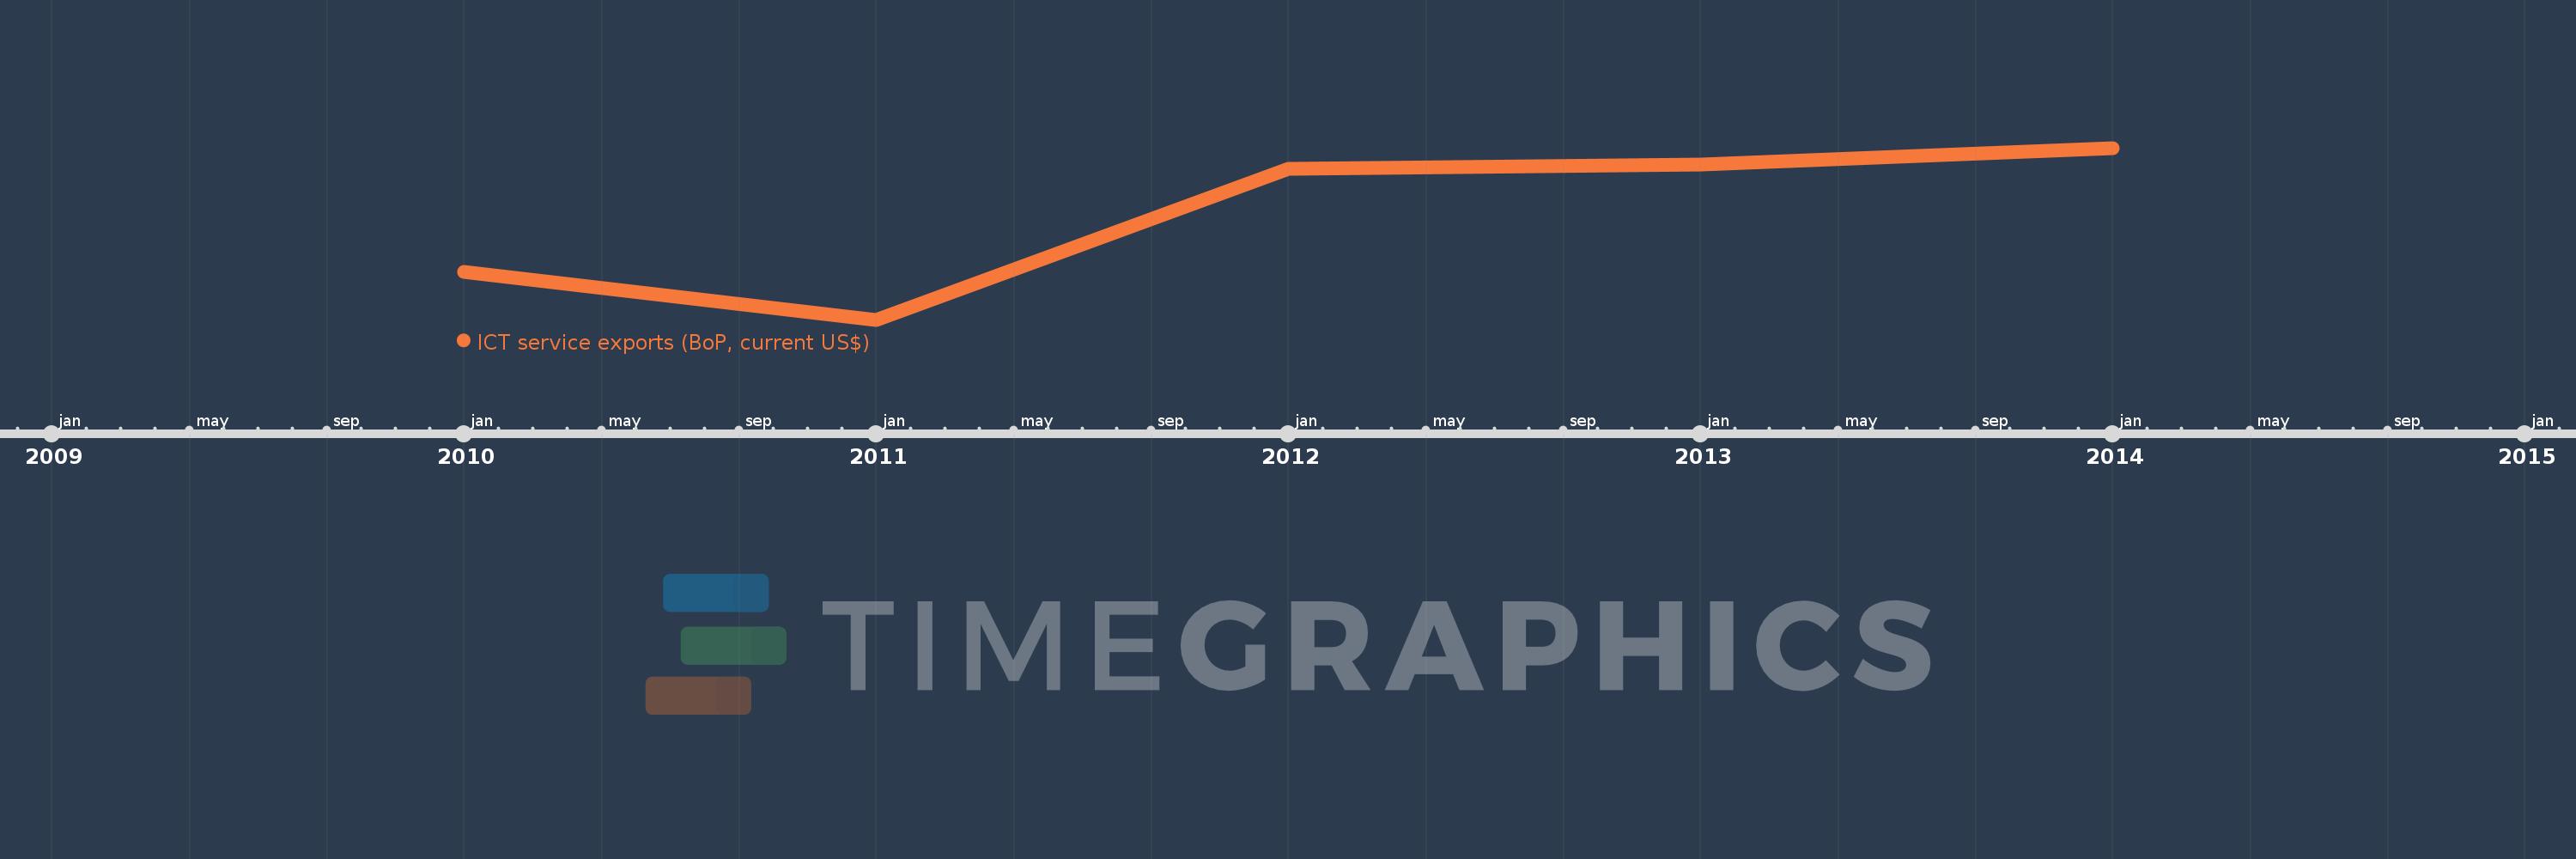
This timeline shows a graph from 2010 to 2014 of East Asia & Pacific (IDA & IBRD countries). No data until 2009. Number of actual observations by date: 5.
Source name:
World Development Indicators
Source organization:
International Monetary Fund, Balance of Payments Statistics Yearbook and data files.
Categories, topics:
Economy & Growth, Infrastructure, Trade
Last updated:
apr 23, 2017
Indicators value changes by year
Meaning:
83.228 bln
Minimum:
26.152 bln
jan 1, 2011
Maximum:
119.481 bln
jan 1, 2014
At the date of observation
Value
Absolute change
Change from the previous value
jan 1, 2010
51.969 bln
+51.969 bln
0.0%
jan 1, 2011
26.152 bln
-25.817 bln
-49.68%
jan 1, 2012
108.279 bln
+82.127 bln
314.04%
jan 1, 2013
110.26 bln
+1.982 bln
1.83%
jan 1, 2014
119.481 bln
+9.221 bln
8.36%
Ranking of countries by current statistics by years