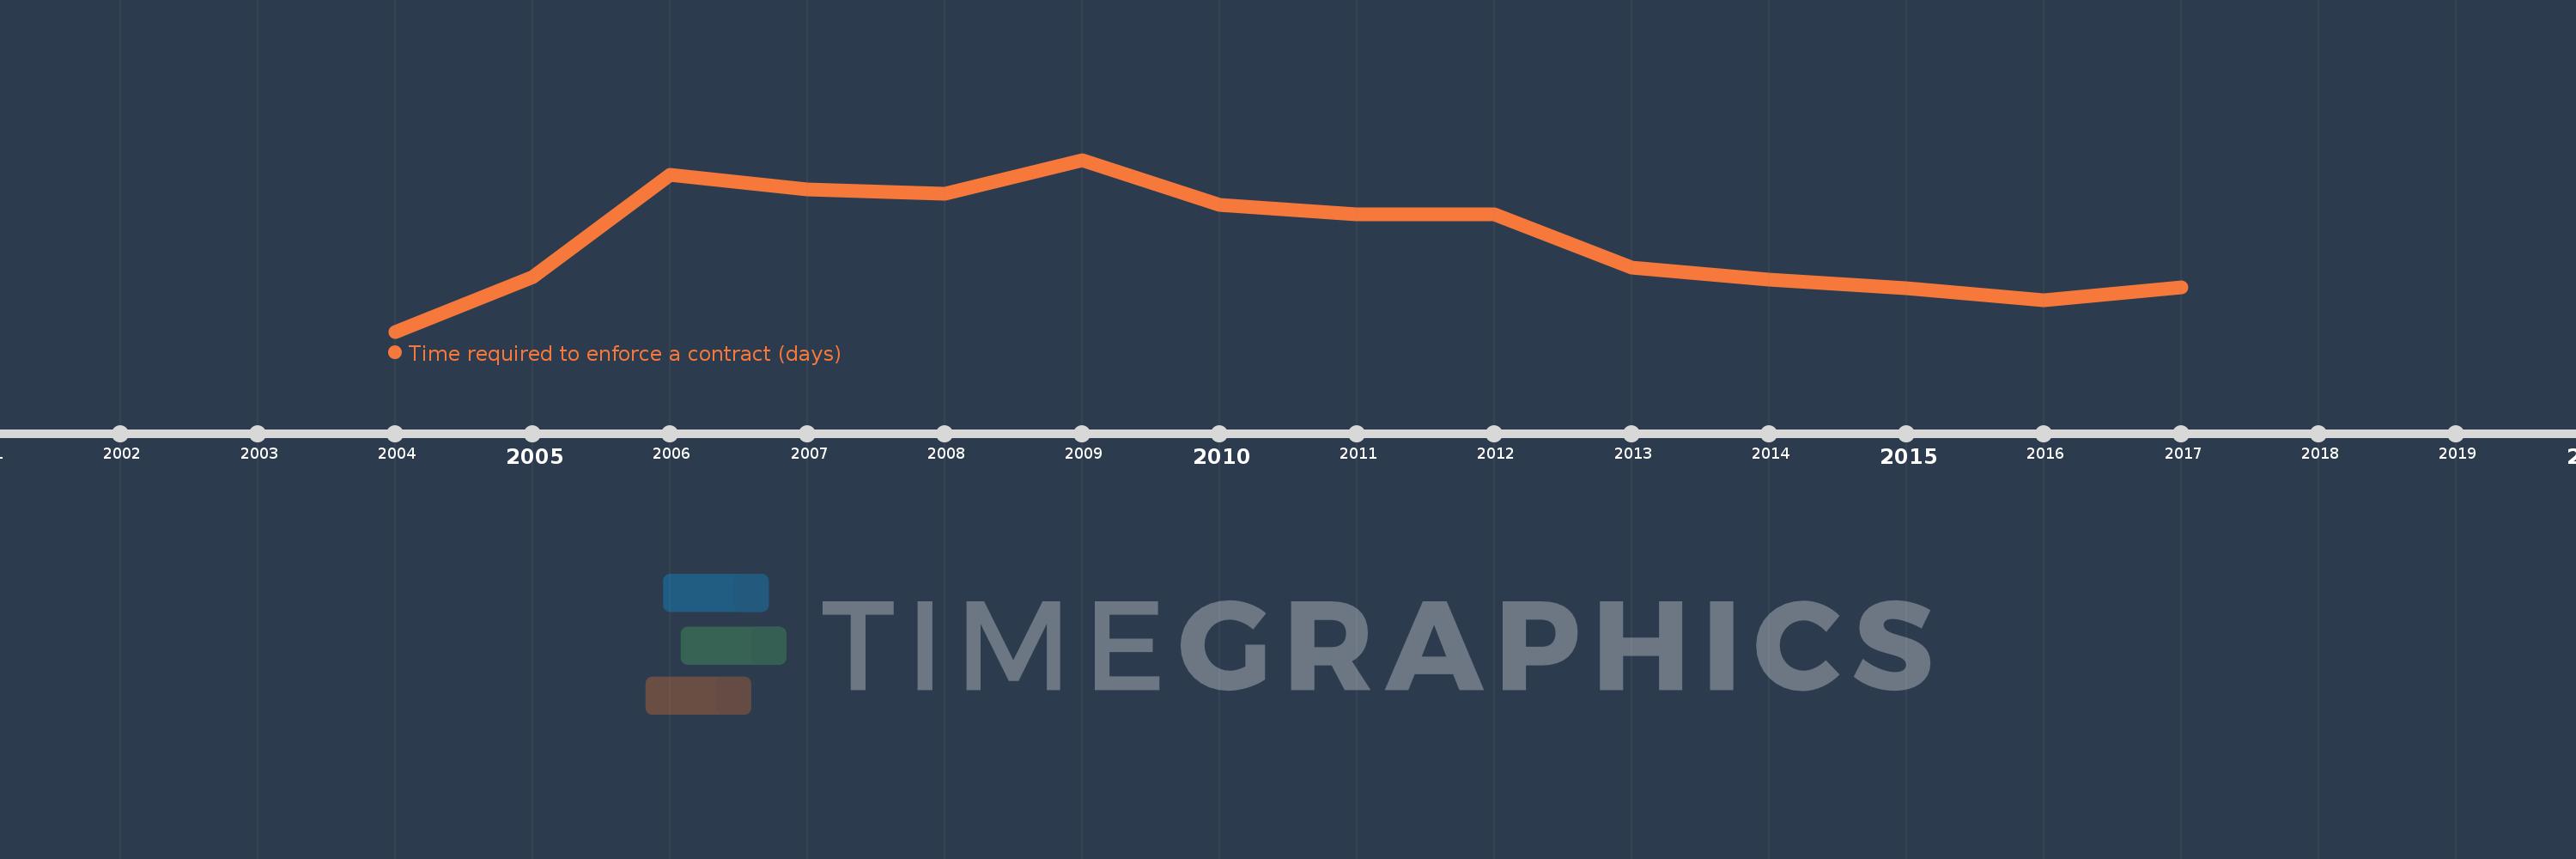
This timeline shows a graph from 2004 to 2017 of Sub-Saharan Africa (excluding high income). No data until 2003. Number of actual observations by date: 14.
Source name:
World Development Indicators
Source organization:
World Bank, Doing Business project (http://www.doingbusiness.org/).
Categories, topics:
Private Sector
Last updated:
apr 23, 2017
Indicators value changes by year
Meaning:
663.465
Minimum:
636.485
jan 1, 2004
Maximum:
688.044
jan 1, 2009
At the date of observation
Value
Absolute change
Change from the previous value
jan 1, 2004
636.485
+636.485
0.0%
jan 1, 2005
652.811
+16.326
2.57%
jan 1, 2006
683.409
+30.598
4.69%
jan 1, 2007
679.2
-4.209
-0.62%
jan 1, 2008
677.756
-1.444
-0.21%
jan 1, 2009
688.044
+10.289
1.52%
jan 1, 2010
674.511
-13.533
-1.97%
jan 1, 2011
671.8
-2.711
-0.4%
jan 1, 2012
671.8
0.0
0.0%
jan 1, 2013
655.565
-16.235
-2.42%
jan 1, 2014
651.974
-3.591
-0.55%
jan 1, 2015
649.583
-2.391
-0.37%
jan 1, 2016
645.868
-3.715
-0.57%
jan 1, 2017
649.698
+3.83
0.59%
Ranking of countries by current statistics by years