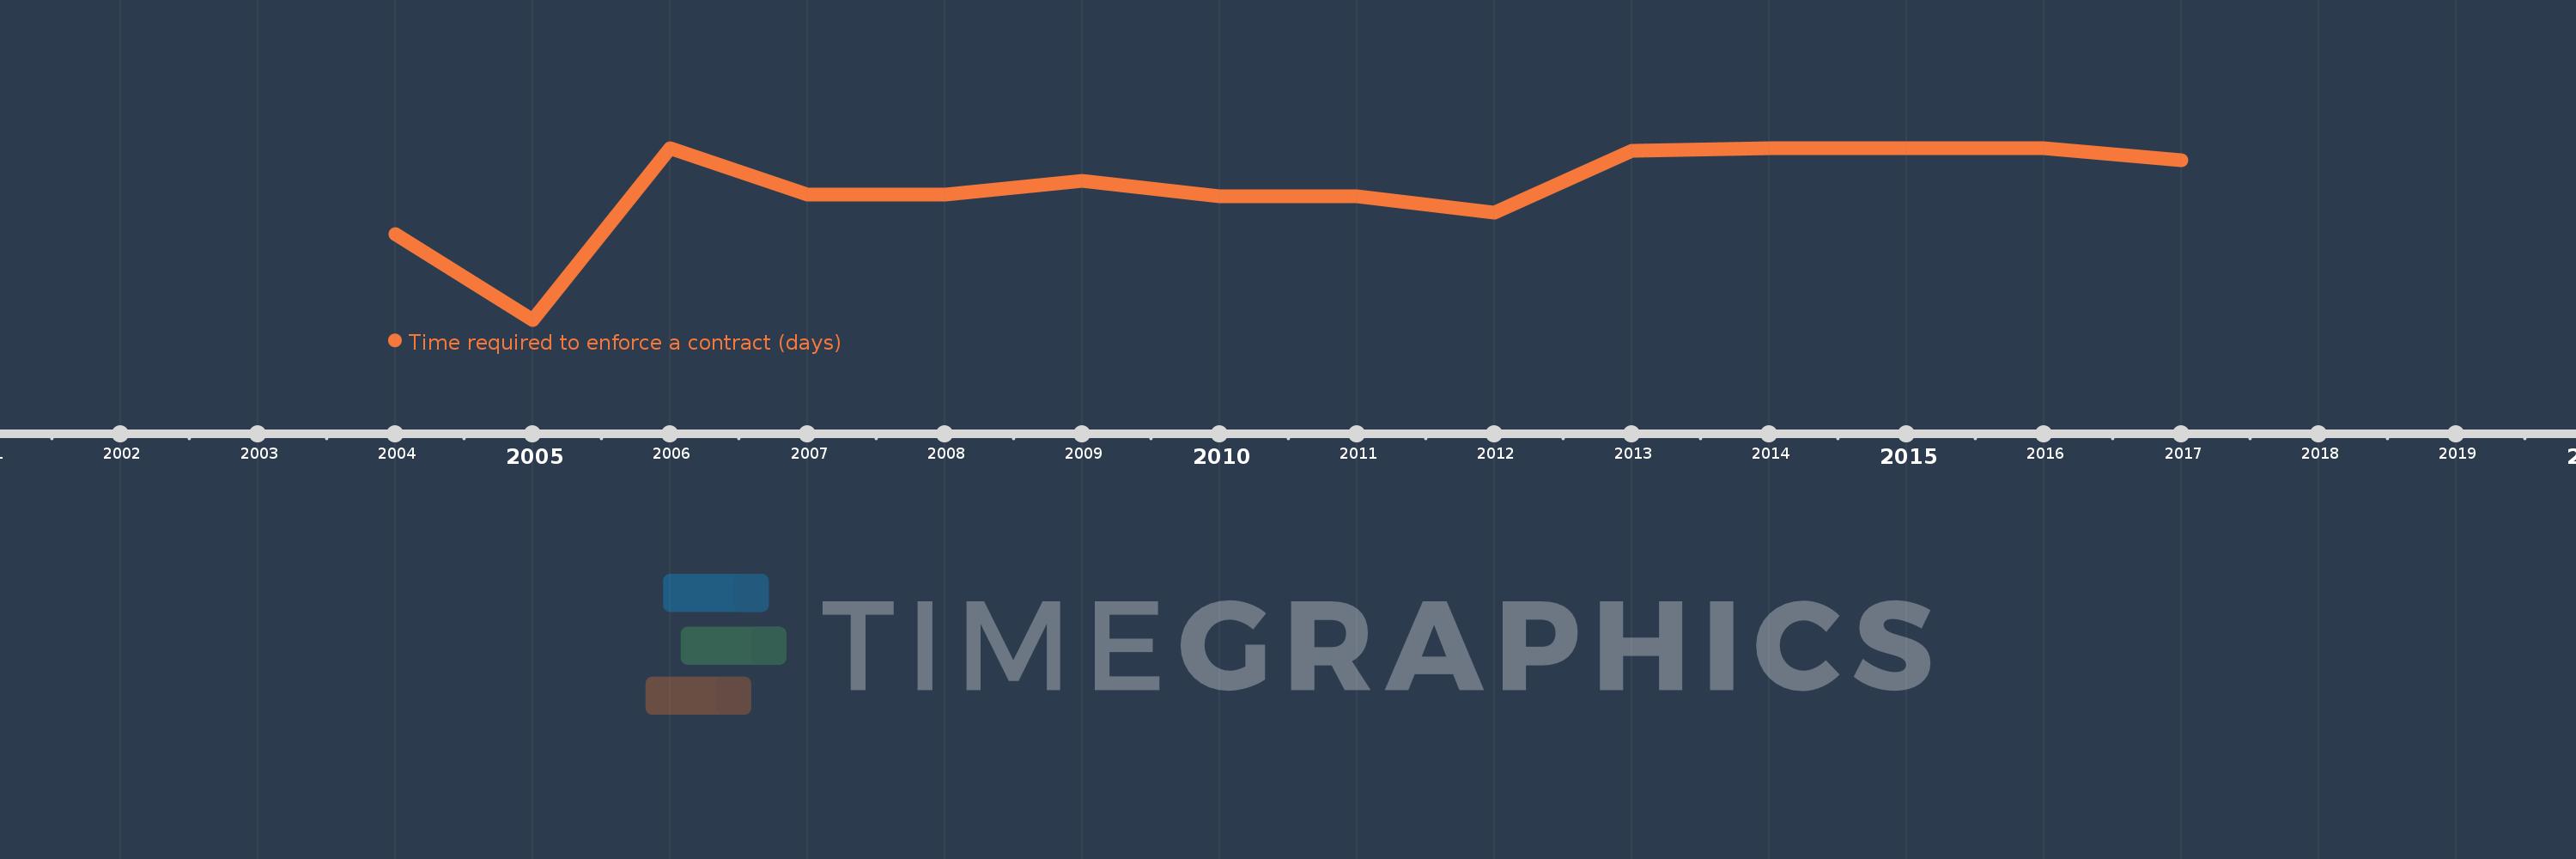
This timeline shows a graph from 2004 to 2017 of Latin America & the Caribbean (IDA & IBRD countries). No data until 2003. Number of actual observations by date: 14.
Source name:
World Development Indicators
Source organization:
World Bank, Doing Business project (http://www.doingbusiness.org/).
Categories, topics:
Private Sector
Last updated:
apr 23, 2017
Indicators value changes by year
Meaning:
725.497
Minimum:
696.905
jan 1, 2005
Maximum:
734.167
jan 1, 2014
At the date of observation
Value
Absolute change
Change from the previous value
jan 1, 2004
715.4
+715.4
0.0%
jan 1, 2005
696.905
-18.495
-2.59%
jan 1, 2006
734.067
+37.162
5.33%
jan 1, 2007
724.1
-9.967
-1.36%
jan 1, 2008
724.1
0.0
0.0%
jan 1, 2009
727.1
+3.0
0.41%
jan 1, 2010
723.767
-3.333
-0.46%
jan 1, 2011
723.767
0.0
0.0%
jan 1, 2012
720.067
-3.7
-0.51%
jan 1, 2013
733.6
+13.533
1.88%
jan 1, 2014
734.167
+0.567
0.08%
jan 1, 2015
734.167
0.0
0.0%
jan 1, 2016
734.167
0.0
0.0%
jan 1, 2017
731.59
-2.577
-0.35%
Ranking of countries by current statistics by years