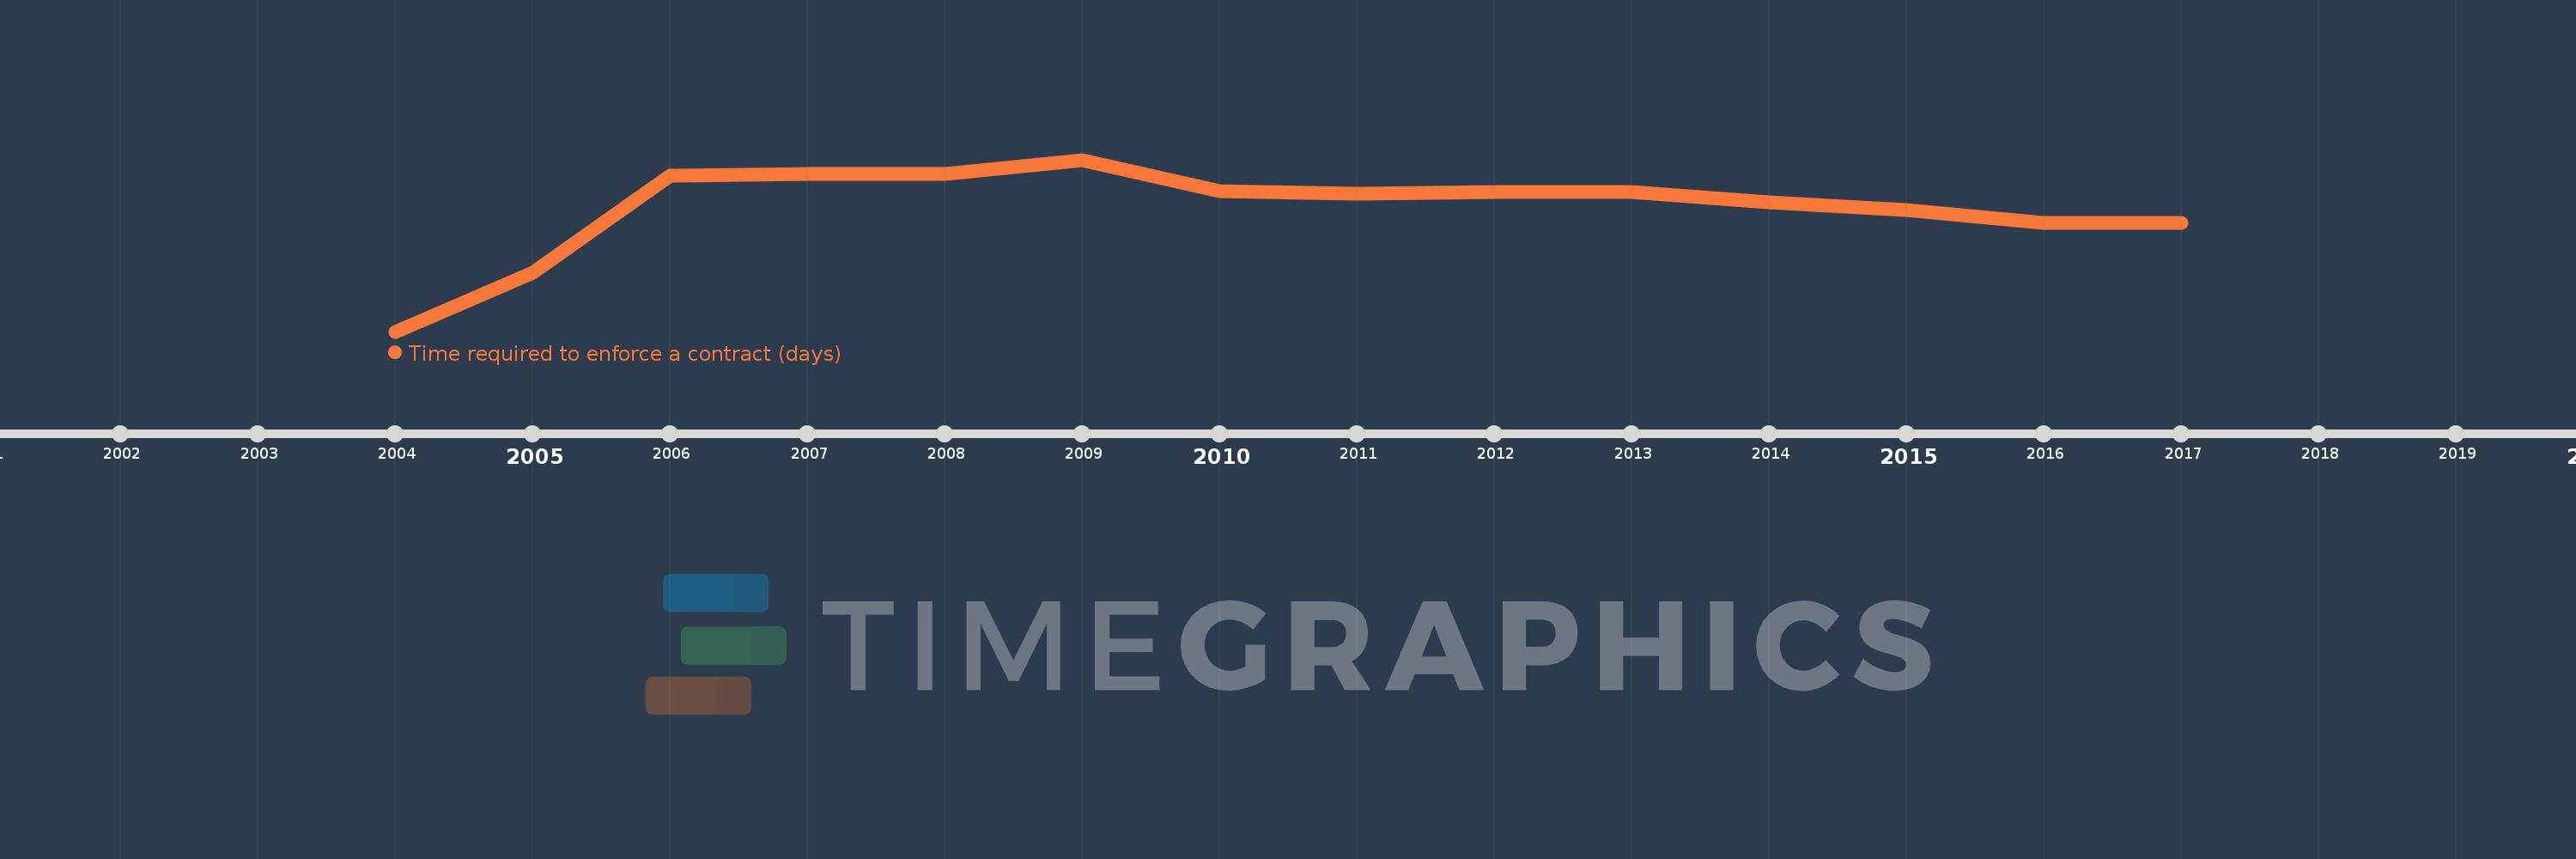
This timeline shows a graph from 2004 to 2017 of Fragile and conflict affected situations. No data until 2003. Number of actual observations by date: 14.
Source name:
World Development Indicators
Source organization:
World Bank, Doing Business project (http://www.doingbusiness.org/).
Categories, topics:
Private Sector
Last updated:
apr 23, 2017
Indicators value changes by year
Meaning:
724.99
Minimum:
655.474
jan 1, 2004
Maximum:
752.276
jan 1, 2009
At the date of observation
Value
Absolute change
Change from the previous value
jan 1, 2004
655.474
+655.474
0.0%
jan 1, 2005
688.792
+33.318
5.08%
jan 1, 2006
743.393
+54.601
7.93%
jan 1, 2007
744.207
+0.814
0.11%
jan 1, 2008
744.207
0.0
0.0%
jan 1, 2009
752.276
+8.069
1.08%
jan 1, 2010
734.4
-17.876
-2.38%
jan 1, 2011
733.033
-1.367
-0.19%
jan 1, 2012
734.033
+1.0
0.14%
jan 1, 2013
734.152
+0.118
0.02%
jan 1, 2014
728.545
-5.606
-0.76%
jan 1, 2015
724.0
-4.545
-0.62%
jan 1, 2016
716.676
-7.324
-1.01%
jan 1, 2017
716.676
0.0
0.0%
Ranking of countries by current statistics by years