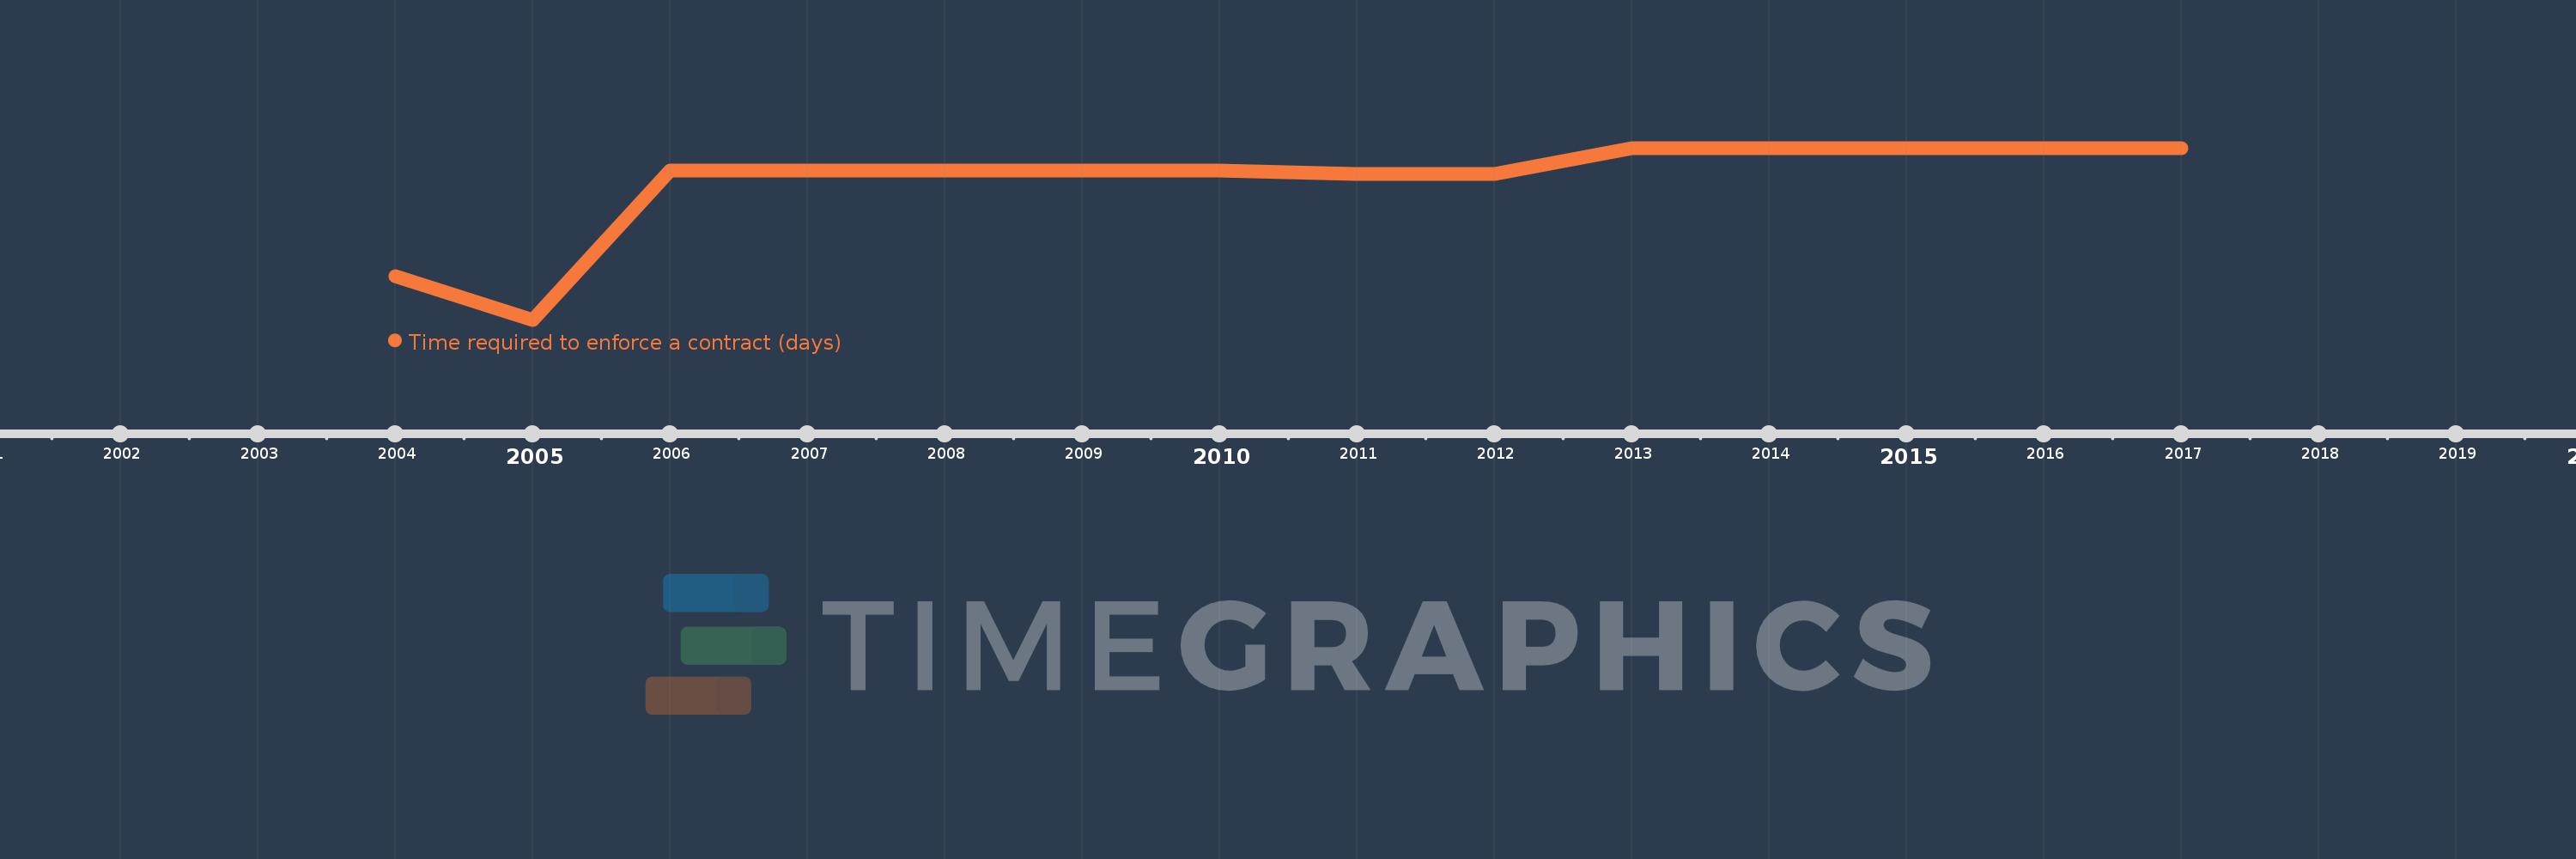
This timeline shows a graph from 2004 to 2017 of Middle East & North Africa (IDA & IBRD countries). No data until 2003. Number of actual observations by date: 14.
Source name:
World Development Indicators
Source organization:
World Bank, Doing Business project (http://www.doingbusiness.org/).
Categories, topics:
Private Sector
Last updated:
apr 23, 2017
Indicators value changes by year
Meaning:
703.698
Minimum:
655.7
jan 1, 2005
Maximum:
715.167
jan 1, 2013
At the date of observation
Value
Absolute change
Change from the previous value
jan 1, 2004
670.778
+670.778
0.0%
jan 1, 2005
655.7
-15.078
-2.25%
jan 1, 2006
707.455
+51.755
7.89%
jan 1, 2007
707.455
0.0
0.0%
jan 1, 2008
707.455
0.0
0.0%
jan 1, 2009
707.455
0.0
0.0%
jan 1, 2010
707.455
0.0
0.0%
jan 1, 2011
706.091
-1.364
-0.19%
jan 1, 2012
706.091
0.0
0.0%
jan 1, 2013
715.167
+9.076
1.29%
jan 1, 2014
715.167
0.0
0.0%
jan 1, 2015
715.167
0.0
0.0%
jan 1, 2016
715.167
0.0
0.0%
jan 1, 2017
715.167
0.0
0.0%
Ranking of countries by current statistics by years