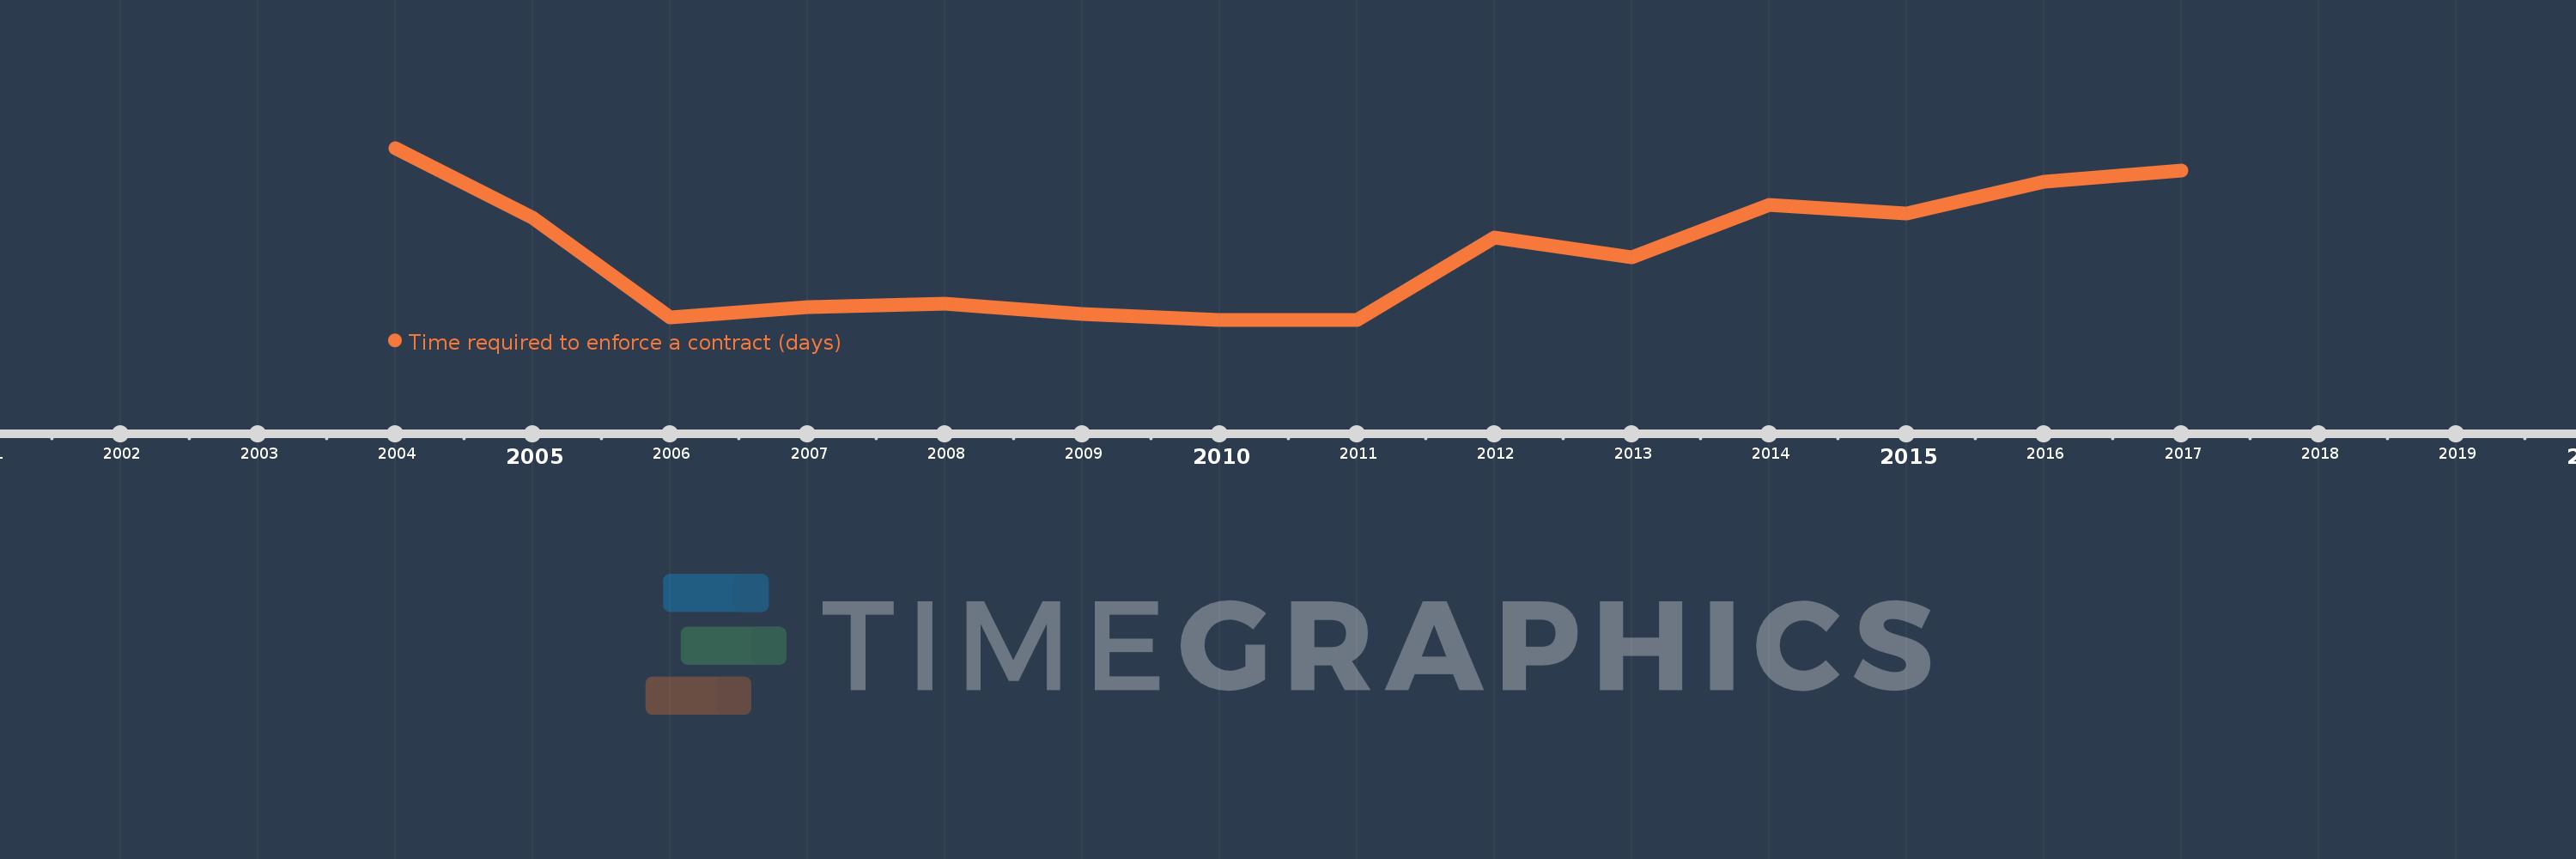
This timeline shows a graph from 2004 to 2017 of Europe & Central Asia (IDA & IBRD countries). No data until 2003. Number of actual observations by date: 14.
Source name:
World Development Indicators
Source organization:
World Bank, Doing Business project (http://www.doingbusiness.org/).
Categories, topics:
Private Sector
Last updated:
apr 23, 2017
Indicators value changes by year
Meaning:
448.978
Minimum:
431.818
jan 1, 2010
Maximum:
474.632
jan 1, 2004
At the date of observation
Value
Absolute change
Change from the previous value
jan 1, 2004
474.632
+474.632
0.0%
jan 1, 2005
457.158
-17.474
-3.68%
jan 1, 2006
432.4
-24.758
-5.42%
jan 1, 2007
435.048
+2.648
0.61%
jan 1, 2008
435.81
+0.762
0.18%
jan 1, 2009
433.19
-2.619
-0.6%
jan 1, 2010
431.818
-1.372
-0.32%
jan 1, 2011
431.818
0.0
0.0%
jan 1, 2012
452.364
+20.545
4.76%
jan 1, 2013
447.364
-5.0
-1.11%
jan 1, 2014
460.5
+13.136
2.94%
jan 1, 2015
458.227
-2.273
-0.49%
jan 1, 2016
466.318
+8.091
1.77%
jan 1, 2017
469.045
+2.727
0.58%
Ranking of countries by current statistics by years