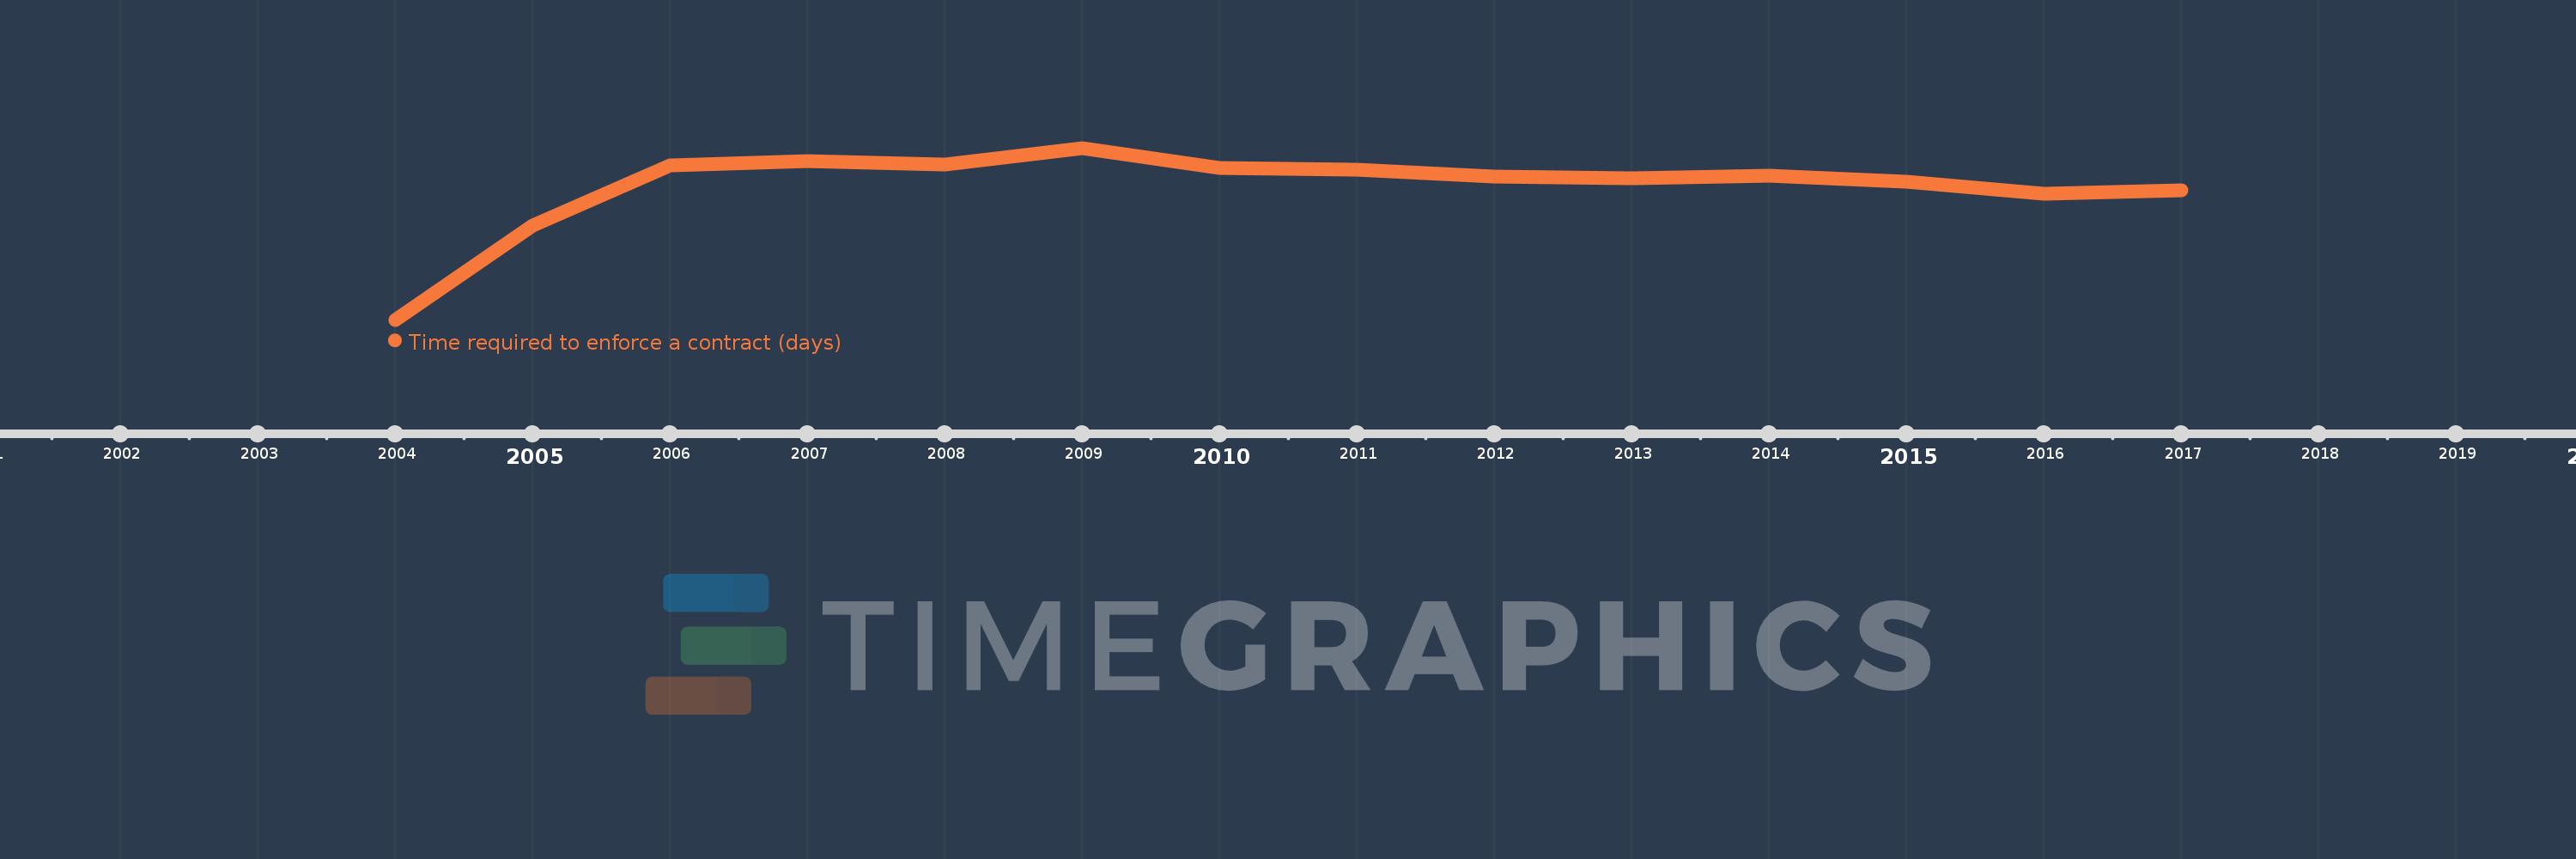
This timeline shows a graph from 2004 to 2017 of Heavily indebted poor countries (HIPC). No data until 2003. Number of actual observations by date: 14.
Source name:
World Development Indicators
Source organization:
World Bank, Doing Business project (http://www.doingbusiness.org/).
Categories, topics:
Private Sector
Last updated:
apr 23, 2017
Indicators value changes by year
Meaning:
681.979
Minimum:
623.345
jan 1, 2004
Maximum:
699.211
jan 1, 2009
At the date of observation
Value
Absolute change
Change from the previous value
jan 1, 2004
623.345
+623.345
0.0%
jan 1, 2005
665.0
+41.655
6.68%
jan 1, 2006
691.459
+26.459
3.98%
jan 1, 2007
693.447
+1.988
0.29%
jan 1, 2008
691.737
-1.711
-0.25%
jan 1, 2009
699.211
+7.474
1.08%
jan 1, 2010
690.289
-8.921
-1.28%
jan 1, 2011
689.474
-0.816
-0.12%
jan 1, 2012
686.553
-2.921
-0.42%
jan 1, 2013
685.842
-0.711
-0.1%
jan 1, 2014
687.105
+1.263
0.18%
jan 1, 2015
684.474
-2.632
-0.38%
jan 1, 2016
679.103
-5.371
-0.78%
jan 1, 2017
680.667
+1.564
0.23%
Ranking of countries by current statistics by years