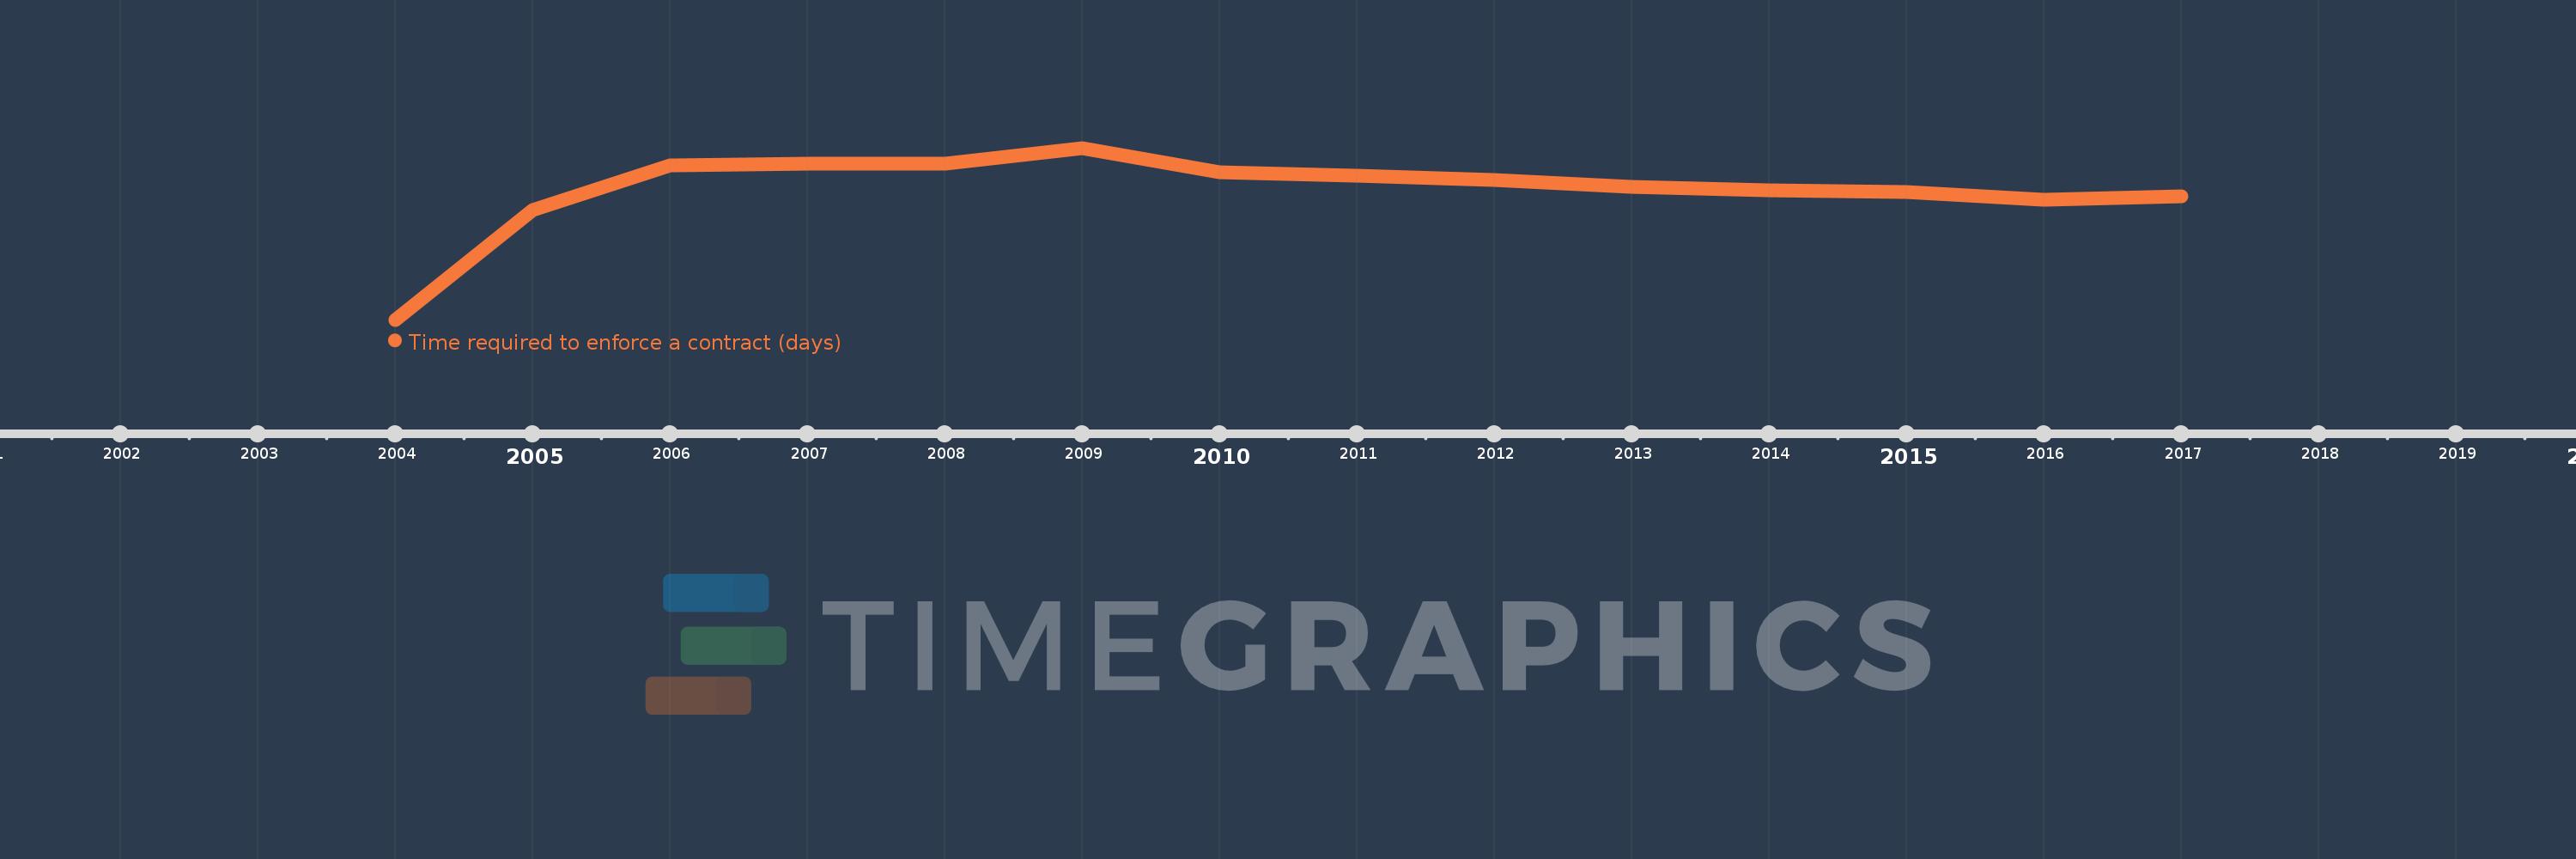
This timeline shows a graph from 2004 to 2017 of Least developed countries: UN classification. No data until 2003. Number of actual observations by date: 14.
Source name:
World Development Indicators
Source organization:
World Bank, Doing Business project (http://www.doingbusiness.org/).
Categories, topics:
Private Sector
Last updated:
apr 23, 2017
Indicators value changes by year
Meaning:
713.41
Minimum:
634.515
jan 1, 2004
Maximum:
739.227
jan 1, 2009
At the date of observation
Value
Absolute change
Change from the previous value
jan 1, 2004
634.515
+634.515
0.0%
jan 1, 2005
701.395
+66.88
10.54%
jan 1, 2006
728.535
+27.14
3.87%
jan 1, 2007
729.409
+0.874
0.12%
jan 1, 2008
729.409
0.0
0.0%
jan 1, 2009
739.227
+9.818
1.35%
jan 1, 2010
724.591
-14.636
-1.98%
jan 1, 2011
722.205
-2.386
-0.33%
jan 1, 2012
719.591
-2.614
-0.36%
jan 1, 2013
715.674
-3.917
-0.54%
jan 1, 2014
713.5
-2.174
-0.3%
jan 1, 2015
712.63
-0.87
-0.12%
jan 1, 2016
707.574
-5.056
-0.71%
jan 1, 2017
709.489
+1.915
0.27%
Ranking of countries by current statistics by years