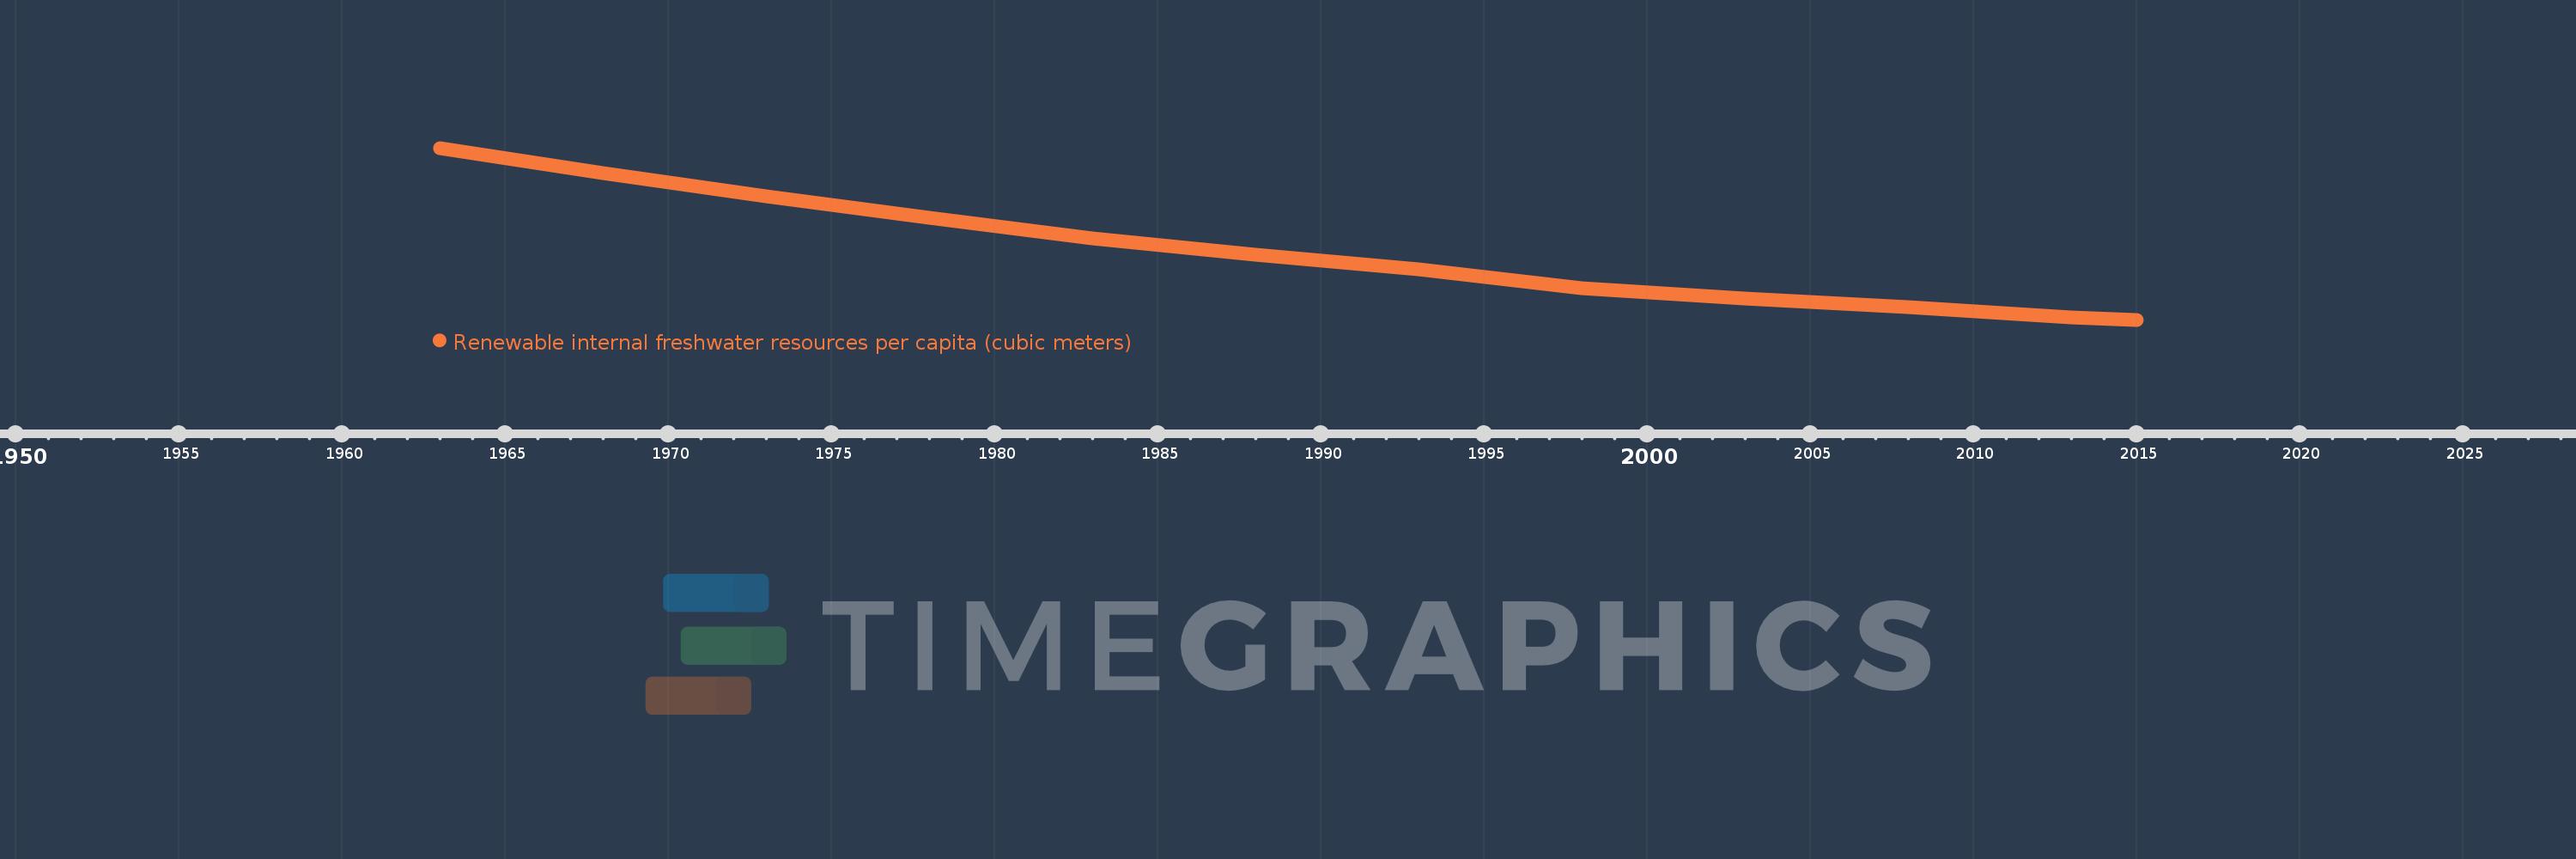
This timeline shows a graph from 1963 to 2015 of Sub-Saharan Africa (excluding high income). No data until 1962. Number of actual observations by date: 12.
Source name:
World Development Indicators
Source organization:
Food and Agriculture Organization, AQUASTAT data.
Categories, topics:
Infrastructure, Environment
Last updated:
apr 23, 2017
Indicators value changes by year
Meaning:
9.611K
Minimum:
3.986K
jan 1, 2015
Maximum:
18.314K
jan 1, 1963
At the date of observation
Value
Absolute change
Change from the previous value
jan 1, 1963
18.314K
+18.314K
0.0%
jan 1, 1968
16.229K
-2.085K
-11.38%
jan 1, 1973
14.304K
-1.925K
-11.86%
jan 1, 1978
12.473K
-1.831K
-12.8%
jan 1, 1983
10.804K
-1.669K
-13.38%
jan 1, 1988
9.391K
-1.413K
-13.08%
jan 1, 1993
8.186K
-1.205K
-12.83%
jan 1, 1998
6.597K
-1.589K
-19.41%
jan 1, 2003
5.777K
-820.723
-12.44%
jan 1, 2008
5.055K
-722.041
-12.5%
jan 1, 2013
4.209K
-845.875
-16.73%
jan 1, 2015
3.986K
-222.535
-5.29%
Ranking of countries by current statistics by years