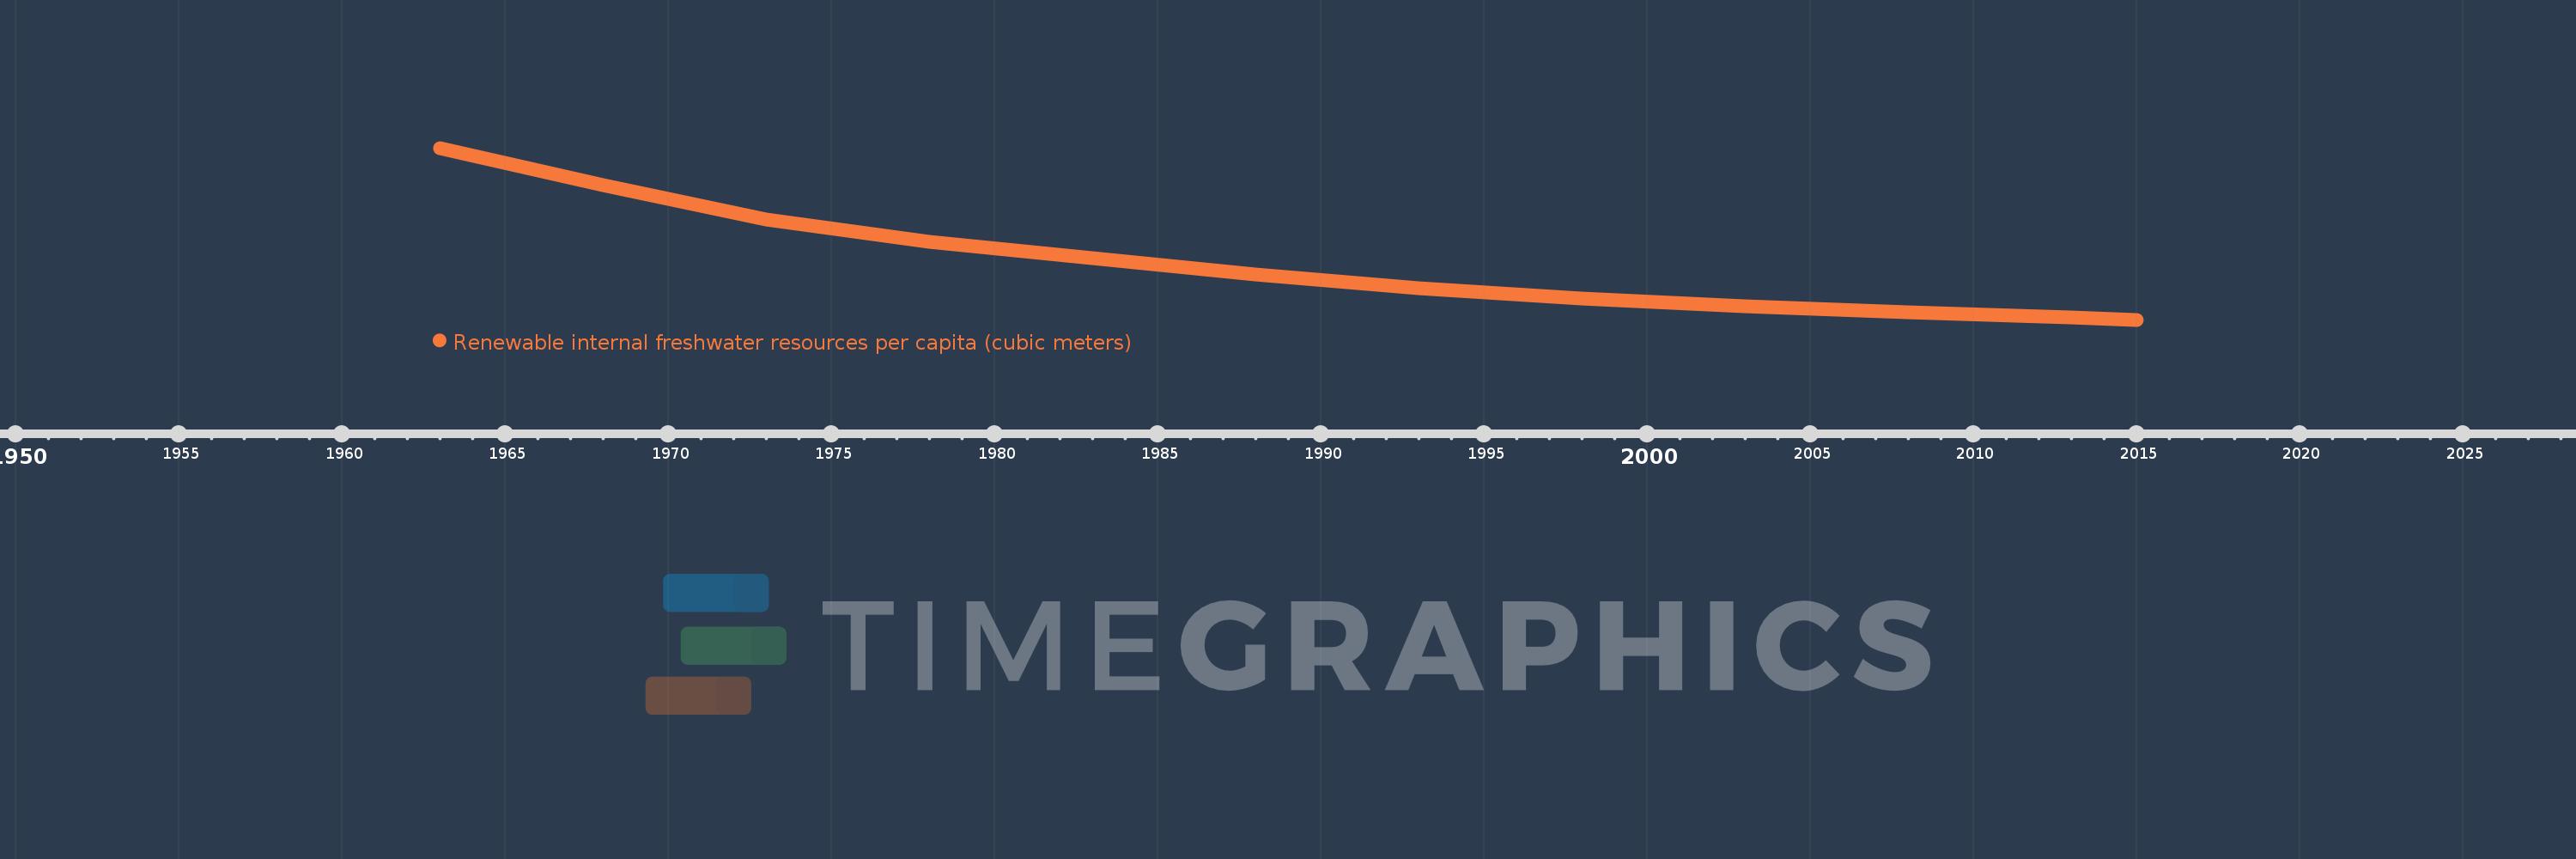
This timeline shows a graph from 1963 to 2015 of East Asia & Pacific (excluding high income). No data until 1962. Number of actual observations by date: 12.
Source name:
World Development Indicators
Source organization:
Food and Agriculture Organization, AQUASTAT data.
Categories, topics:
Infrastructure, Environment
Last updated:
apr 23, 2017
Indicators value changes by year
Meaning:
6.073K
Minimum:
4.348K
jan 1, 2015
Maximum:
9.683K
jan 1, 1963
At the date of observation
Value
Absolute change
Change from the previous value
jan 1, 1963
9.683K
+9.683K
0.0%
jan 1, 1968
8.532K
-1.151K
-11.89%
jan 1, 1973
7.471K
-1.06K
-12.43%
jan 1, 1978
6.77K
-701.298
-9.39%
jan 1, 1983
6.257K
-513.588
-7.59%
jan 1, 1988
5.761K
-495.951
-7.93%
jan 1, 1993
5.323K
-437.381
-7.59%
jan 1, 1998
5.0K
-323.323
-6.07%
jan 1, 2003
4.754K
-246.29
-4.93%
jan 1, 2008
4.569K
-184.882
-3.89%
jan 1, 2013
4.411K
-157.568
-3.45%
jan 1, 2015
4.348K
-63.031
-1.43%
Ranking of countries by current statistics by years