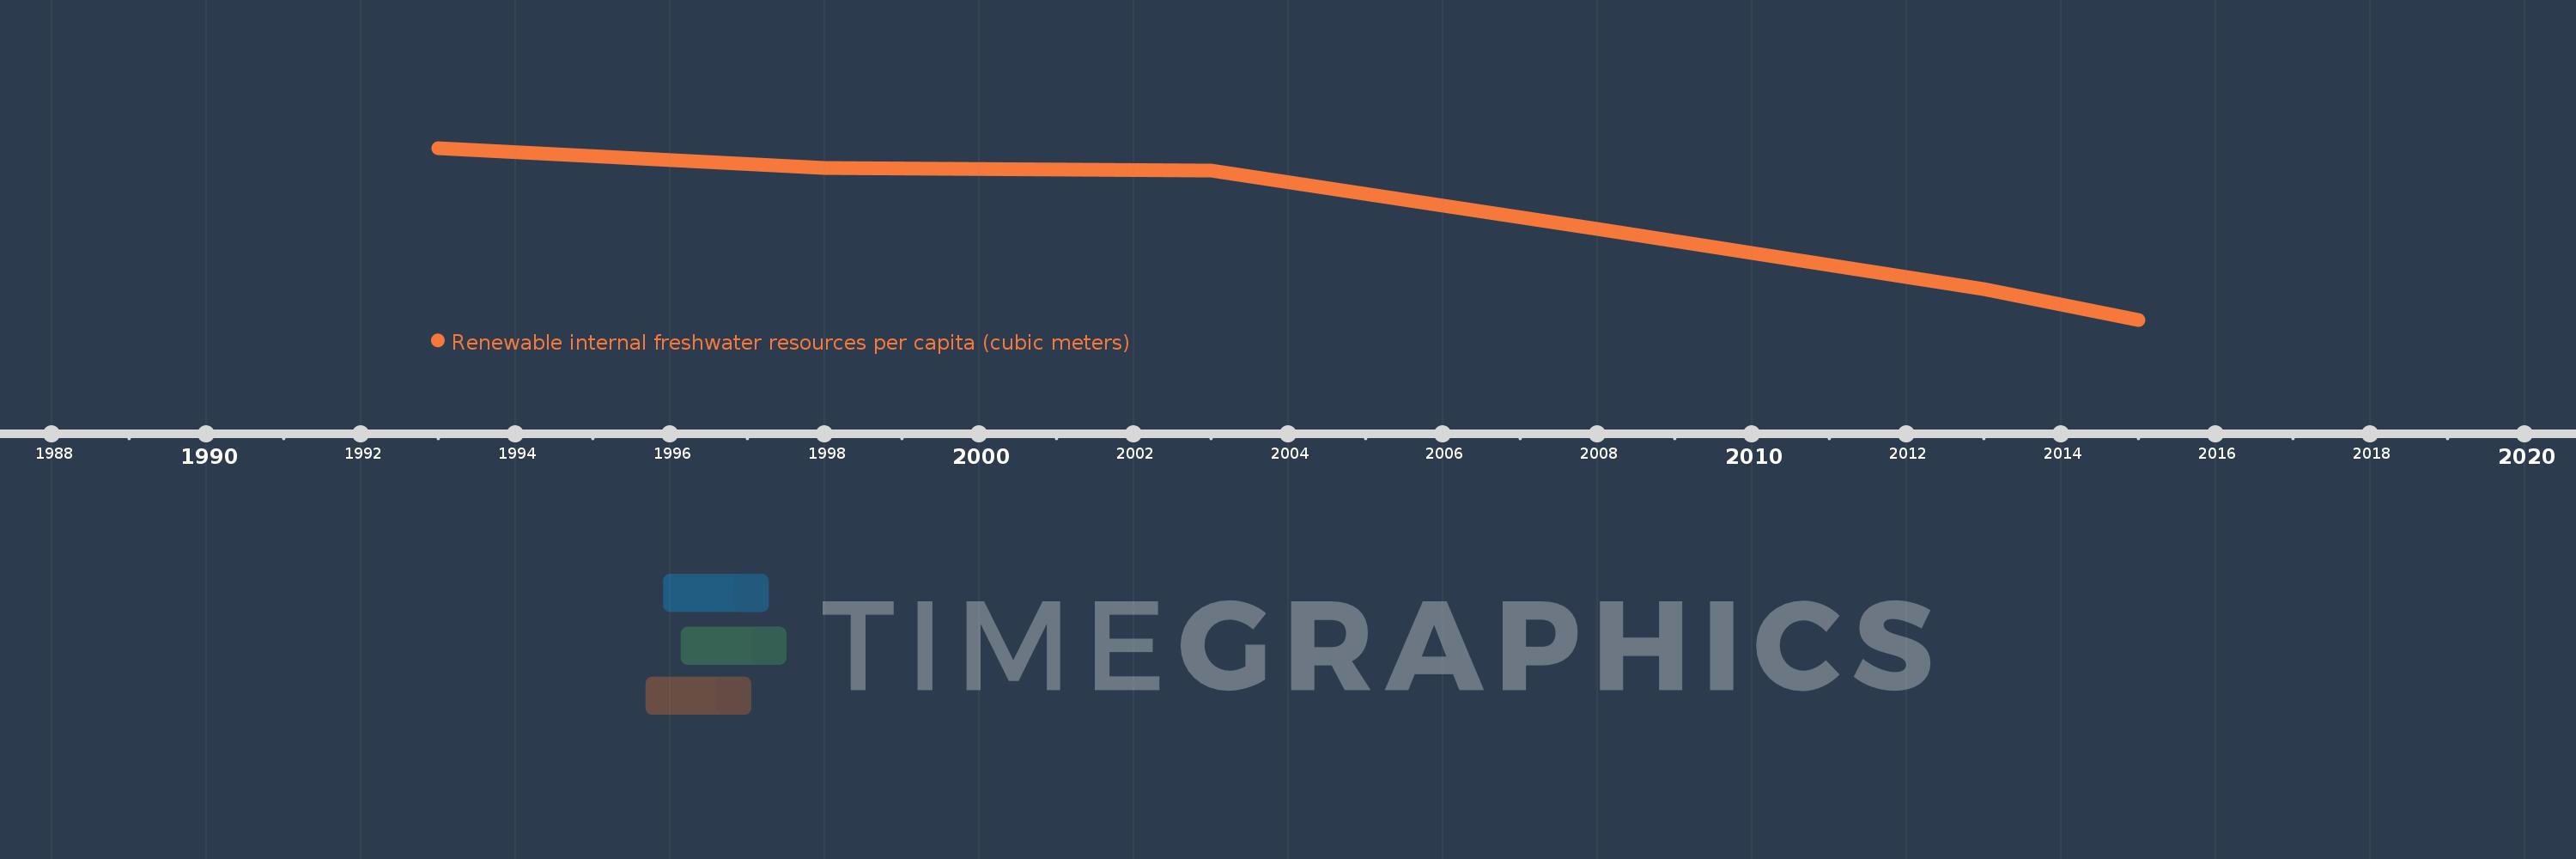
This timeline shows a graph from 1993 to 2015 of Europe & Central Asia (excluding high income). No data until 1992. Number of actual observations by date: 6.
Source name:
World Development Indicators
Source organization:
Food and Agriculture Organization, AQUASTAT data.
Categories, topics:
Infrastructure, Environment
Last updated:
apr 23, 2017
Indicators value changes by year
Meaning:
12.897K
Minimum:
12.389K
jan 1, 2015
Maximum:
13.27K
jan 1, 1993
At the date of observation
Value
Absolute change
Change from the previous value
jan 1, 1993
13.27K
+13.27K
0.0%
jan 1, 1998
13.167K
-103.171
-0.78%
jan 1, 2003
13.153K
-13.73
-0.1%
jan 1, 2008
12.854K
-299.222
-2.27%
jan 1, 2013
12.548K
-305.384
-2.38%
jan 1, 2015
12.389K
-158.798
-1.27%
Ranking of countries by current statistics by years