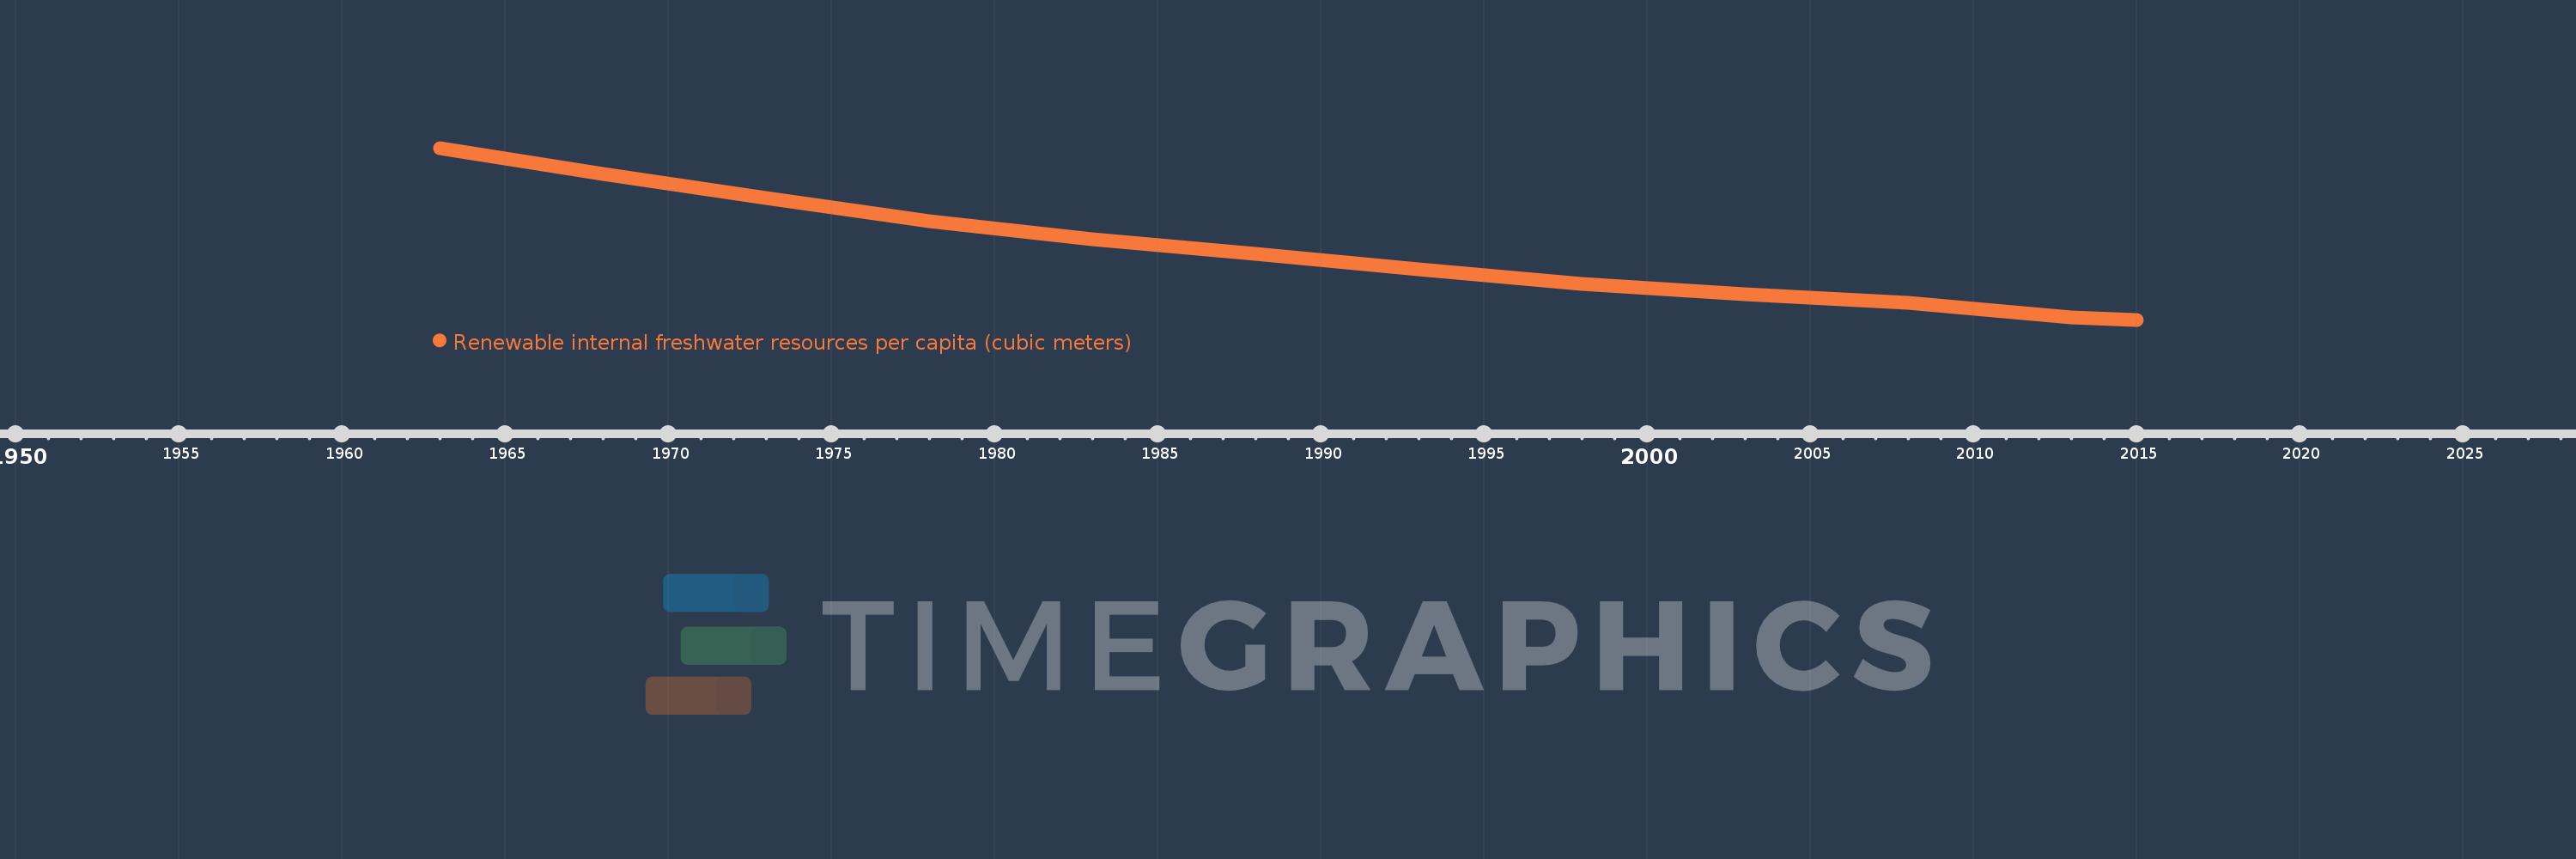
This timeline shows a graph from 1963 to 2015 of Fragile and conflict affected situations. No data until 1962. Number of actual observations by date: 12.
Source name:
World Development Indicators
Source organization:
Food and Agriculture Organization, AQUASTAT data.
Categories, topics:
Infrastructure, Environment
Last updated:
apr 23, 2017
Indicators value changes by year
Meaning:
19.011K
Minimum:
8.347K
jan 1, 2015
Maximum:
35.329K
jan 1, 1963
At the date of observation
Value
Absolute change
Change from the previous value
jan 1, 1963
35.329K
+35.329K
0.0%
jan 1, 1968
31.245K
-4.084K
-11.56%
jan 1, 1973
27.401K
-3.845K
-12.3%
jan 1, 1978
23.877K
-3.524K
-12.86%
jan 1, 1983
20.948K
-2.929K
-12.27%
jan 1, 1988
18.67K
-2.278K
-10.88%
jan 1, 1993
16.212K
-2.458K
-13.16%
jan 1, 1998
14.009K
-2.203K
-13.59%
jan 1, 2003
12.398K
-1.61K
-11.49%
jan 1, 2008
10.947K
-1.451K
-11.71%
jan 1, 2013
8.744K
-2.202K
-20.12%
jan 1, 2015
8.347K
-396.889
-4.54%
Ranking of countries by current statistics by years