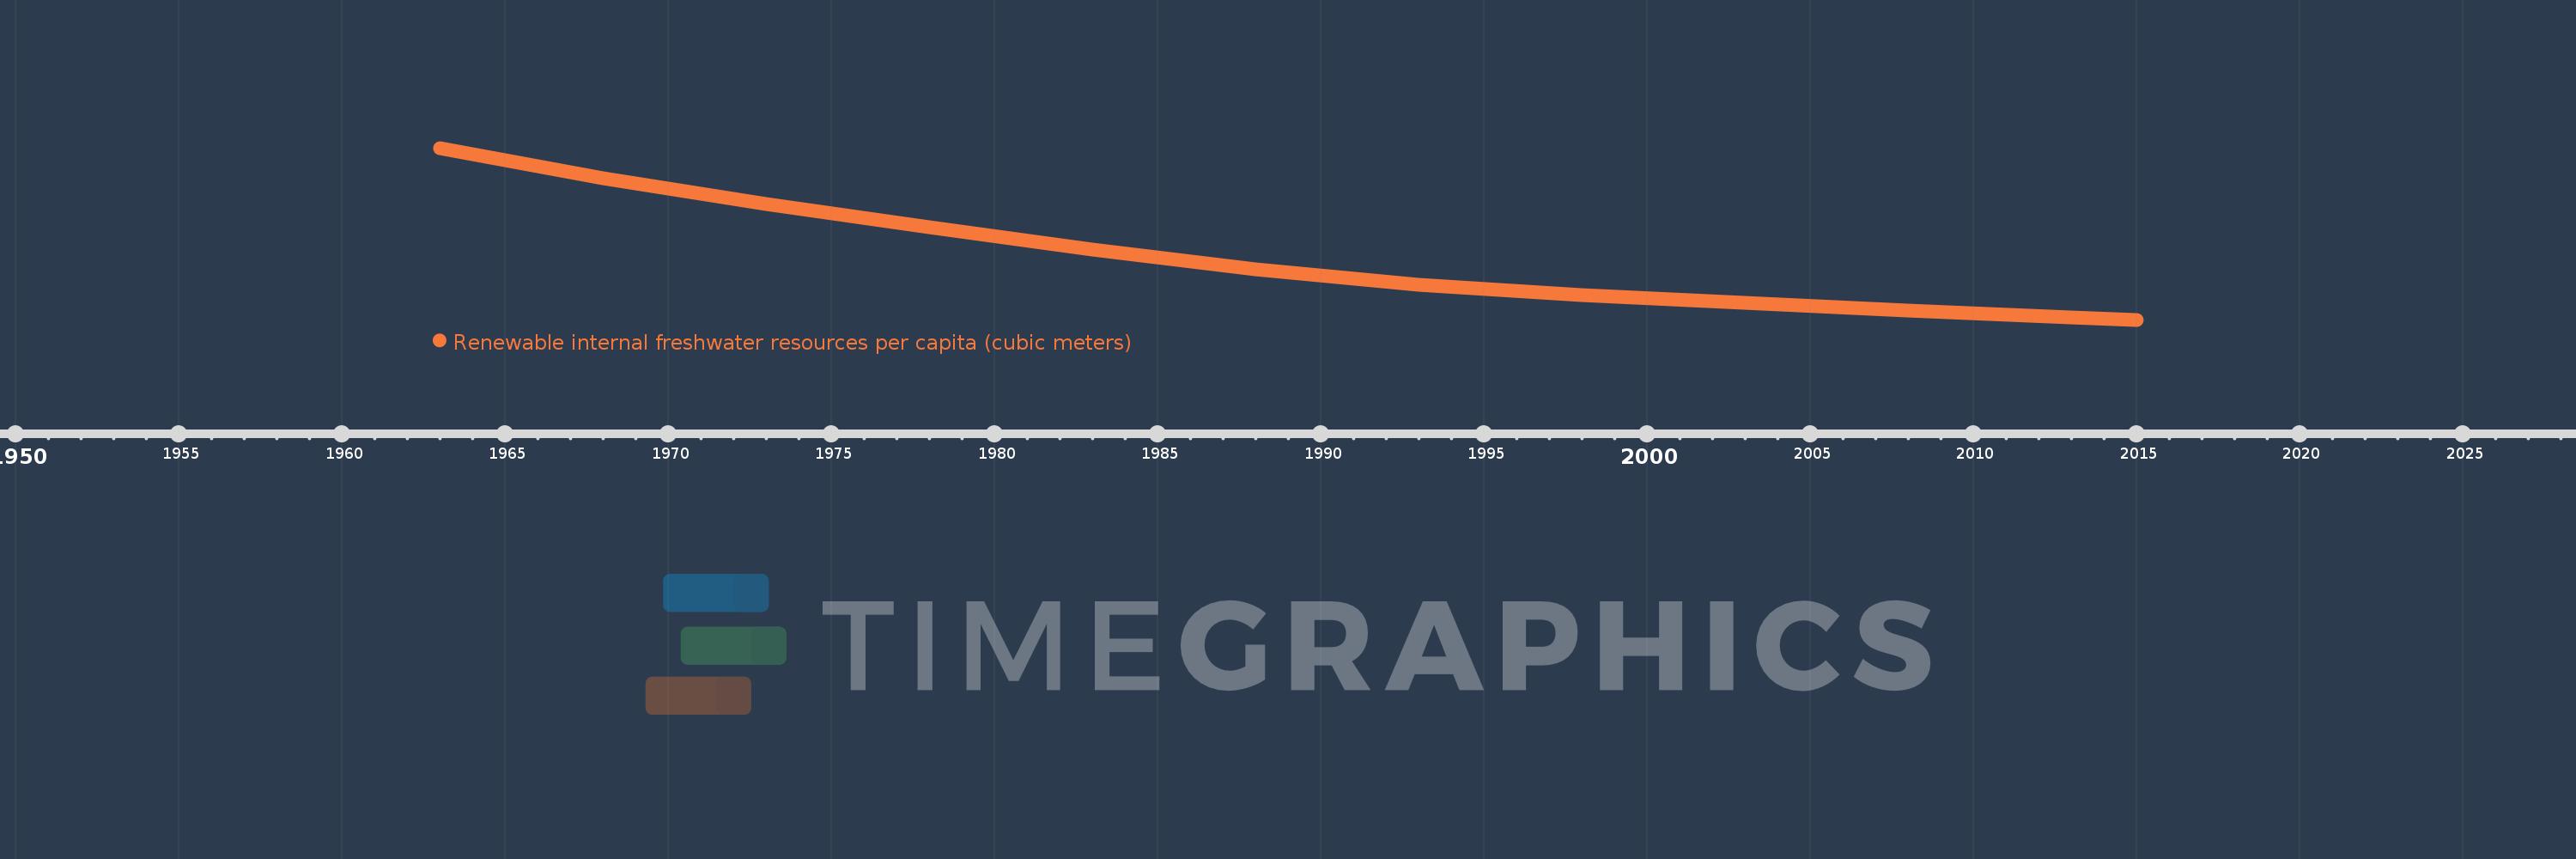
This timeline shows a graph from 1963 to 2015 of Middle East & North Africa (excluding high income). No data until 1962. Number of actual observations by date: 12.
Source name:
World Development Indicators
Source organization:
Food and Agriculture Organization, AQUASTAT data.
Categories, topics:
Infrastructure, Environment
Last updated:
apr 23, 2017
Indicators value changes by year
Meaning:
1.186K
Minimum:
635.685
jan 1, 2015
Maximum:
2.187K
jan 1, 1963
At the date of observation
Value
Absolute change
Change from the previous value
jan 1, 1963
2.187K
+2.187K
0.0%
jan 1, 1968
1.913K
-273.715
-12.52%
jan 1, 1973
1.68K
-232.592
-12.16%
jan 1, 1978
1.474K
-205.851
-12.25%
jan 1, 1983
1.271K
-203.271
-13.79%
jan 1, 1988
1.091K
-180.544
-14.2%
jan 1, 1993
953.794
-136.781
-12.54%
jan 1, 1998
860.025
-93.768
-9.83%
jan 1, 2003
785.118
-74.907
-8.71%
jan 1, 2008
720.027
-65.091
-8.29%
jan 1, 2013
658.46
-61.567
-8.55%
jan 1, 2015
635.685
-22.775
-3.46%
Ranking of countries by current statistics by years