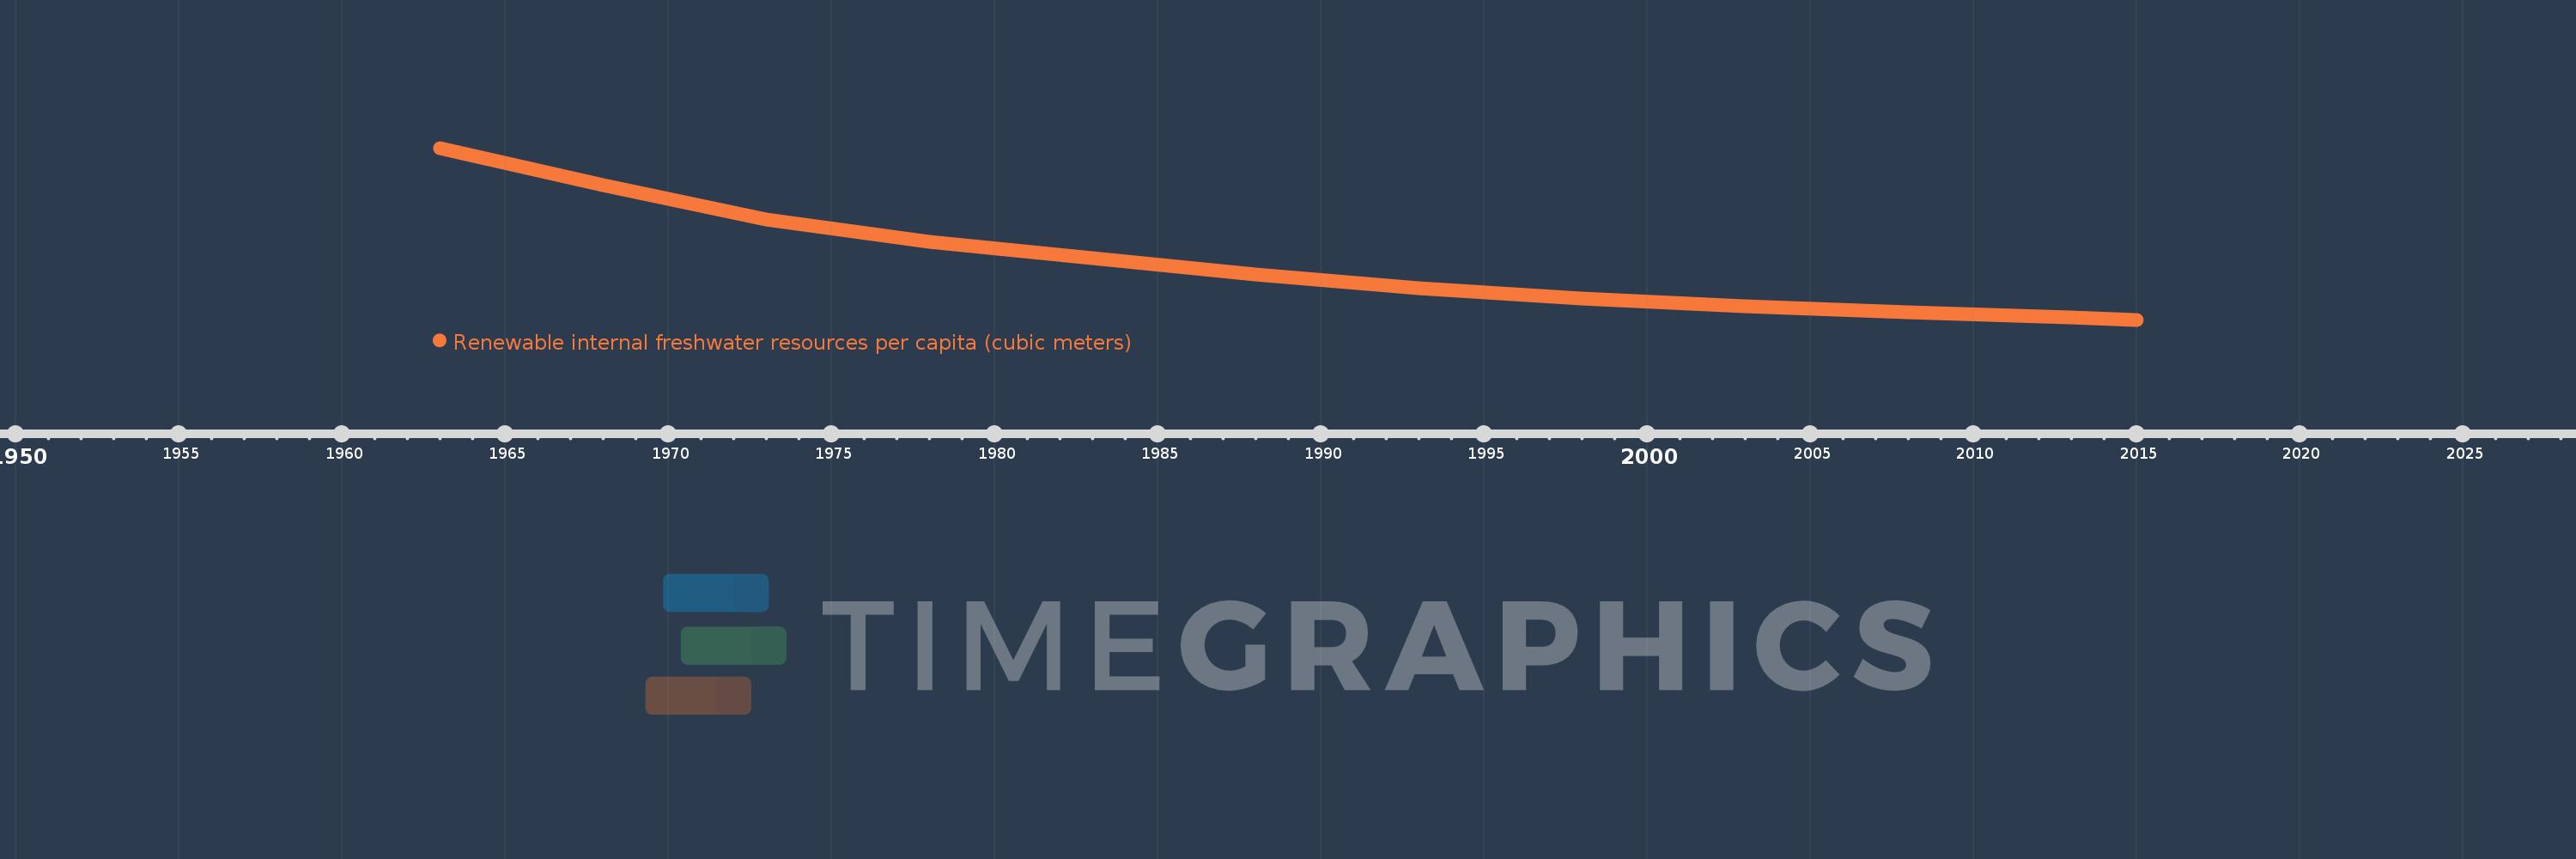
This timeline shows a graph from 1963 to 2015 of East Asia & Pacific (IDA & IBRD countries). No data until 1962. Number of actual observations by date: 12.
Source name:
World Development Indicators
Source organization:
Food and Agriculture Organization, AQUASTAT data.
Categories, topics:
Infrastructure, Environment
Last updated:
apr 23, 2017
Indicators value changes by year
Meaning:
6.105K
Minimum:
4.369K
jan 1, 2015
Maximum:
9.737K
jan 1, 1963
At the date of observation
Value
Absolute change
Change from the previous value
jan 1, 1963
9.737K
+9.737K
0.0%
jan 1, 1968
8.577K
-1.16K
-11.91%
jan 1, 1973
7.512K
-1.065K
-12.42%
jan 1, 1978
6.806K
-705.243
-9.39%
jan 1, 1983
6.289K
-517.408
-7.6%
jan 1, 1988
5.79K
-498.931
-7.93%
jan 1, 1993
5.35K
-439.899
-7.6%
jan 1, 1998
5.025K
-324.801
-6.07%
jan 1, 2003
4.777K
-247.925
-4.93%
jan 1, 2008
4.591K
-185.995
-3.89%
jan 1, 2013
4.433K
-158.825
-3.46%
jan 1, 2015
4.369K
-63.547
-1.43%
Ranking of countries by current statistics by years