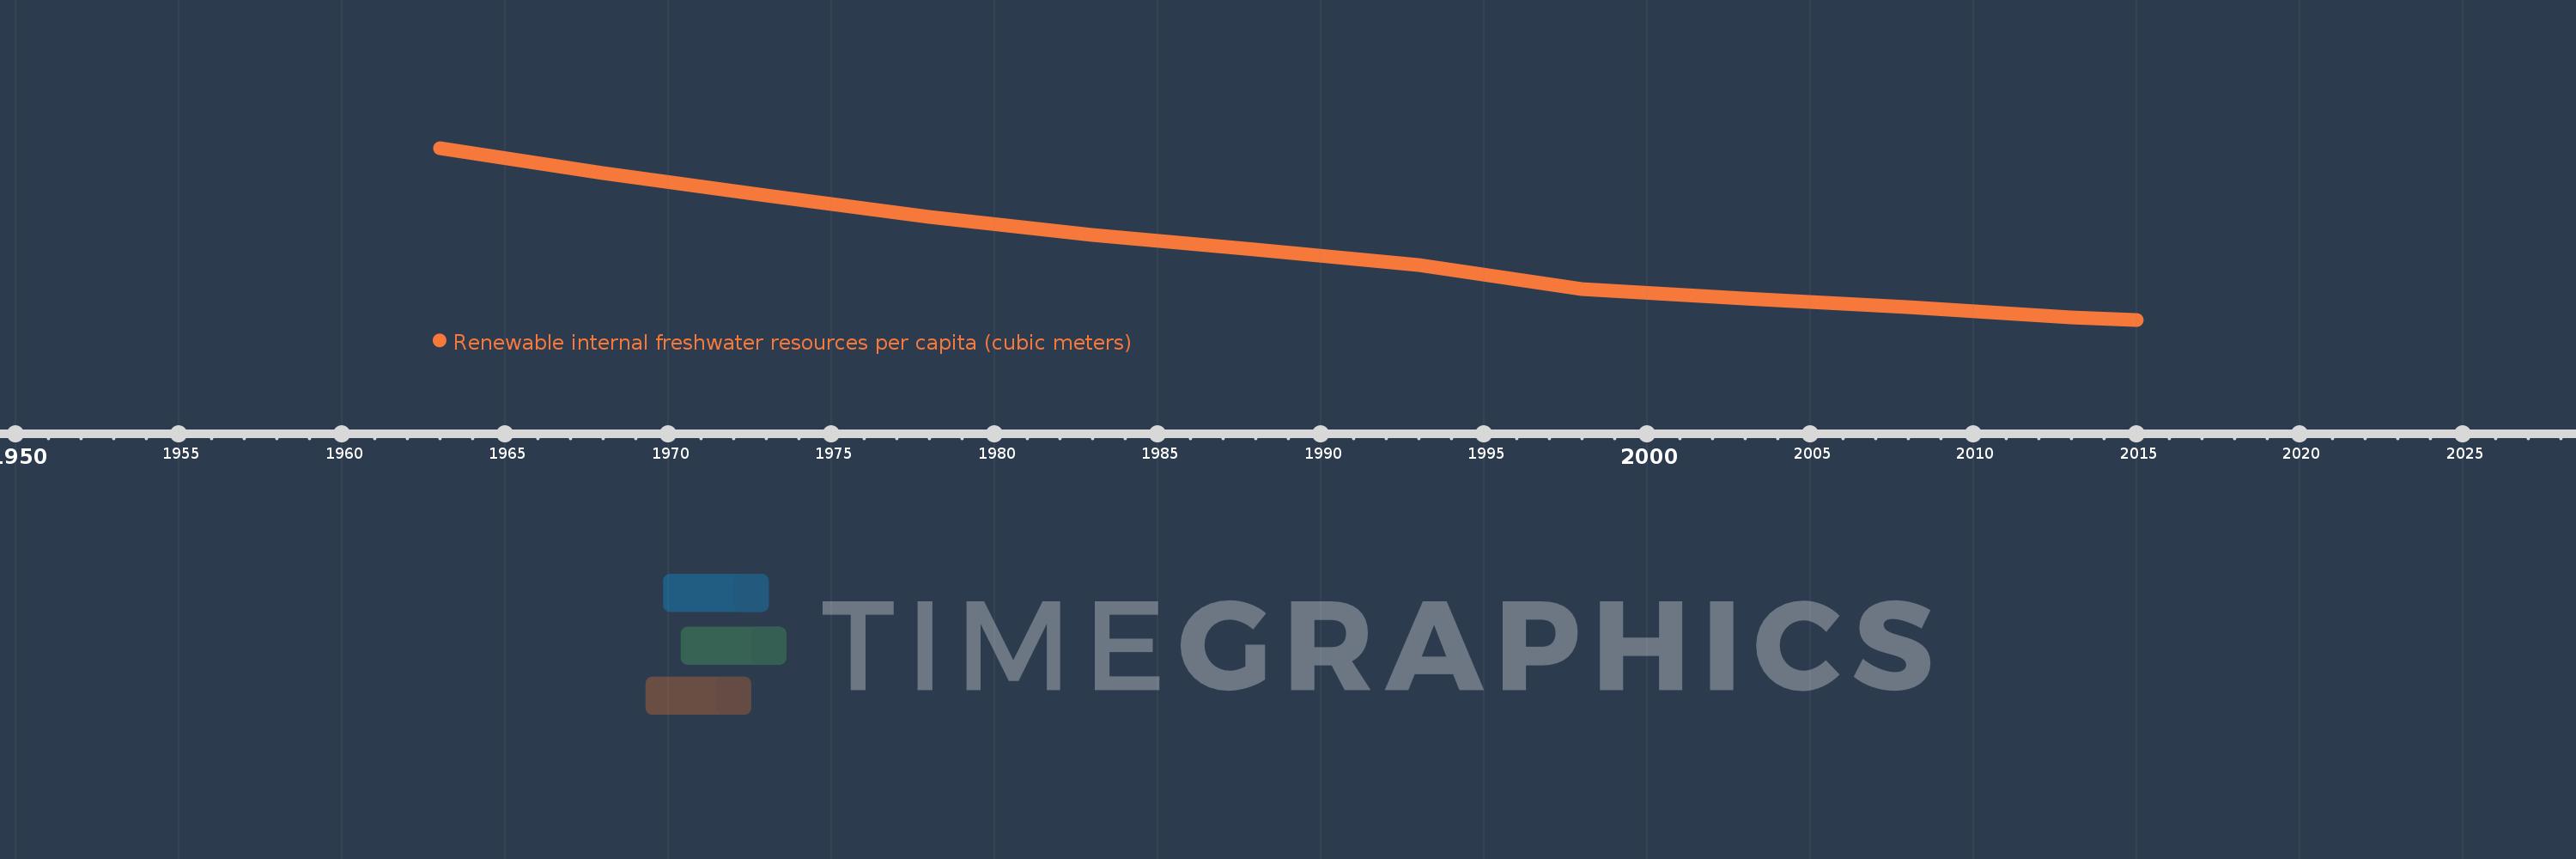
This timeline shows a graph from 1963 to 2015 of Heavily indebted poor countries (HIPC). No data until 1962. Number of actual observations by date: 12.
Source name:
World Development Indicators
Source organization:
Food and Agriculture Organization, AQUASTAT data.
Categories, topics:
Infrastructure, Environment
Last updated:
apr 23, 2017
Indicators value changes by year
Meaning:
14.854K
Minimum:
5.776K
jan 1, 2015
Maximum:
28.508K
jan 1, 1963
At the date of observation
Value
Absolute change
Change from the previous value
jan 1, 1963
28.508K
+28.508K
0.0%
jan 1, 1968
25.227K
-3.281K
-11.51%
jan 1, 1973
22.202K
-3.026K
-11.99%
jan 1, 1978
19.417K
-2.784K
-12.54%
jan 1, 1983
17.039K
-2.378K
-12.25%
jan 1, 1988
15.036K
-2.003K
-11.76%
jan 1, 1993
13.062K
-1.974K
-13.13%
jan 1, 1998
9.863K
-3.199K
-24.49%
jan 1, 2003
8.577K
-1.286K
-13.04%
jan 1, 2008
7.439K
-1.138K
-13.26%
jan 1, 2013
6.102K
-1.337K
-17.97%
jan 1, 2015
5.776K
-326.557
-5.35%
Ranking of countries by current statistics by years