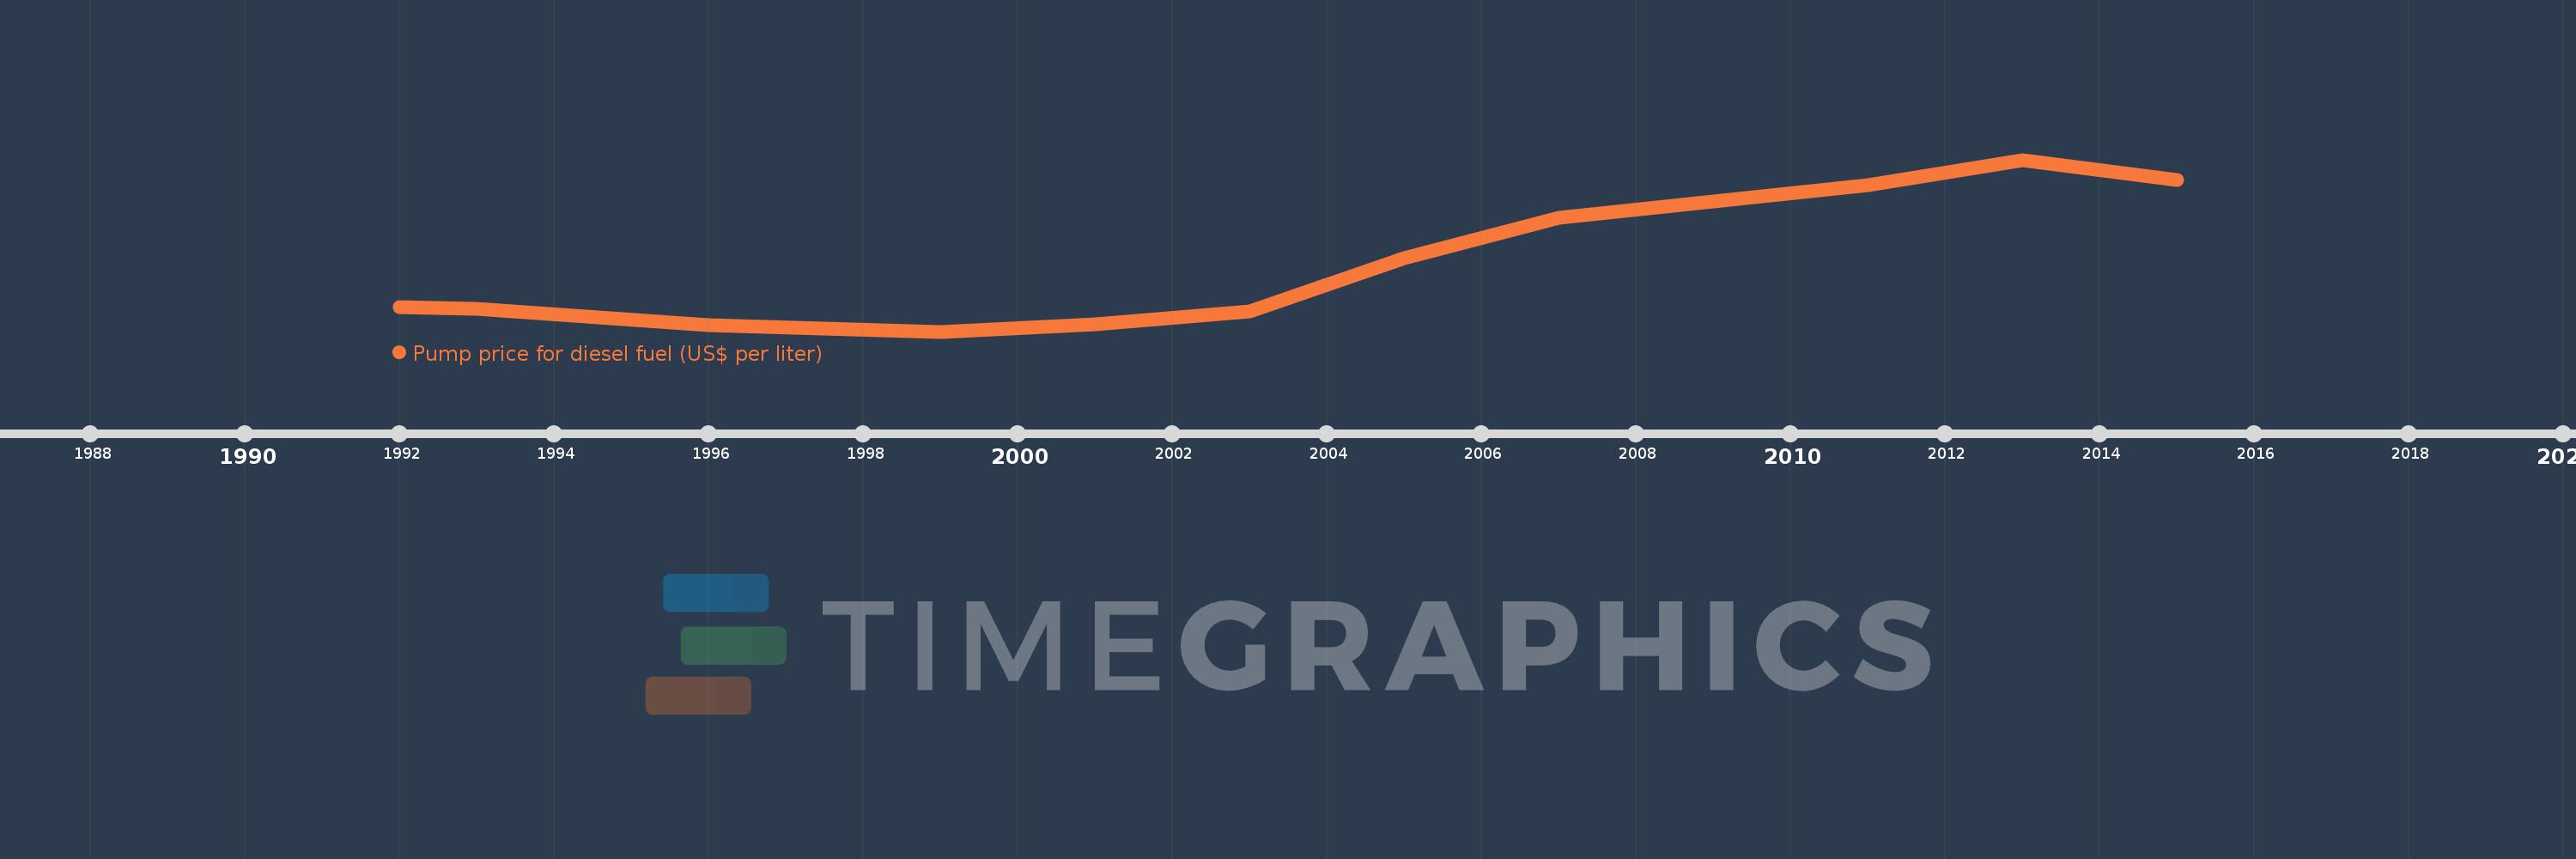
This timeline shows a graph from 1992 to 2015 of Sub-Saharan Africa (excluding high income). No data until 1991. Number of actual observations by date: 12.
Source name:
World Development Indicators
Source organization:
German Agency for International Cooperation (GIZ).
Categories, topics:
Energy & Mining, Urban Development
Last updated:
apr 23, 2017
Indicators value changes by year
Meaning:
0.783
Minimum:
0.43
jan 1, 1999
Maximum:
1.27
jan 1, 2013
At the date of observation
Value
Absolute change
Change from the previous value
jan 1, 1992
0.55
+0.55
0.0%
jan 1, 1993
0.54
-0.01
-1.82%
jan 1, 1996
0.46
-0.08
-14.81%
jan 1, 1999
0.43
-0.03
-6.52%
jan 1, 2001
0.465
+0.035
8.14%
jan 1, 2003
0.53
+0.065
13.98%
jan 1, 2005
0.79
+0.26
49.06%
jan 1, 2007
0.985
+0.195
24.68%
jan 1, 2009
1.065
+0.08
8.12%
jan 1, 2011
1.145
+0.08
7.51%
jan 1, 2013
1.27
+0.125
10.92%
jan 1, 2015
1.17
-0.1
-7.87%
Ranking of countries by current statistics by years