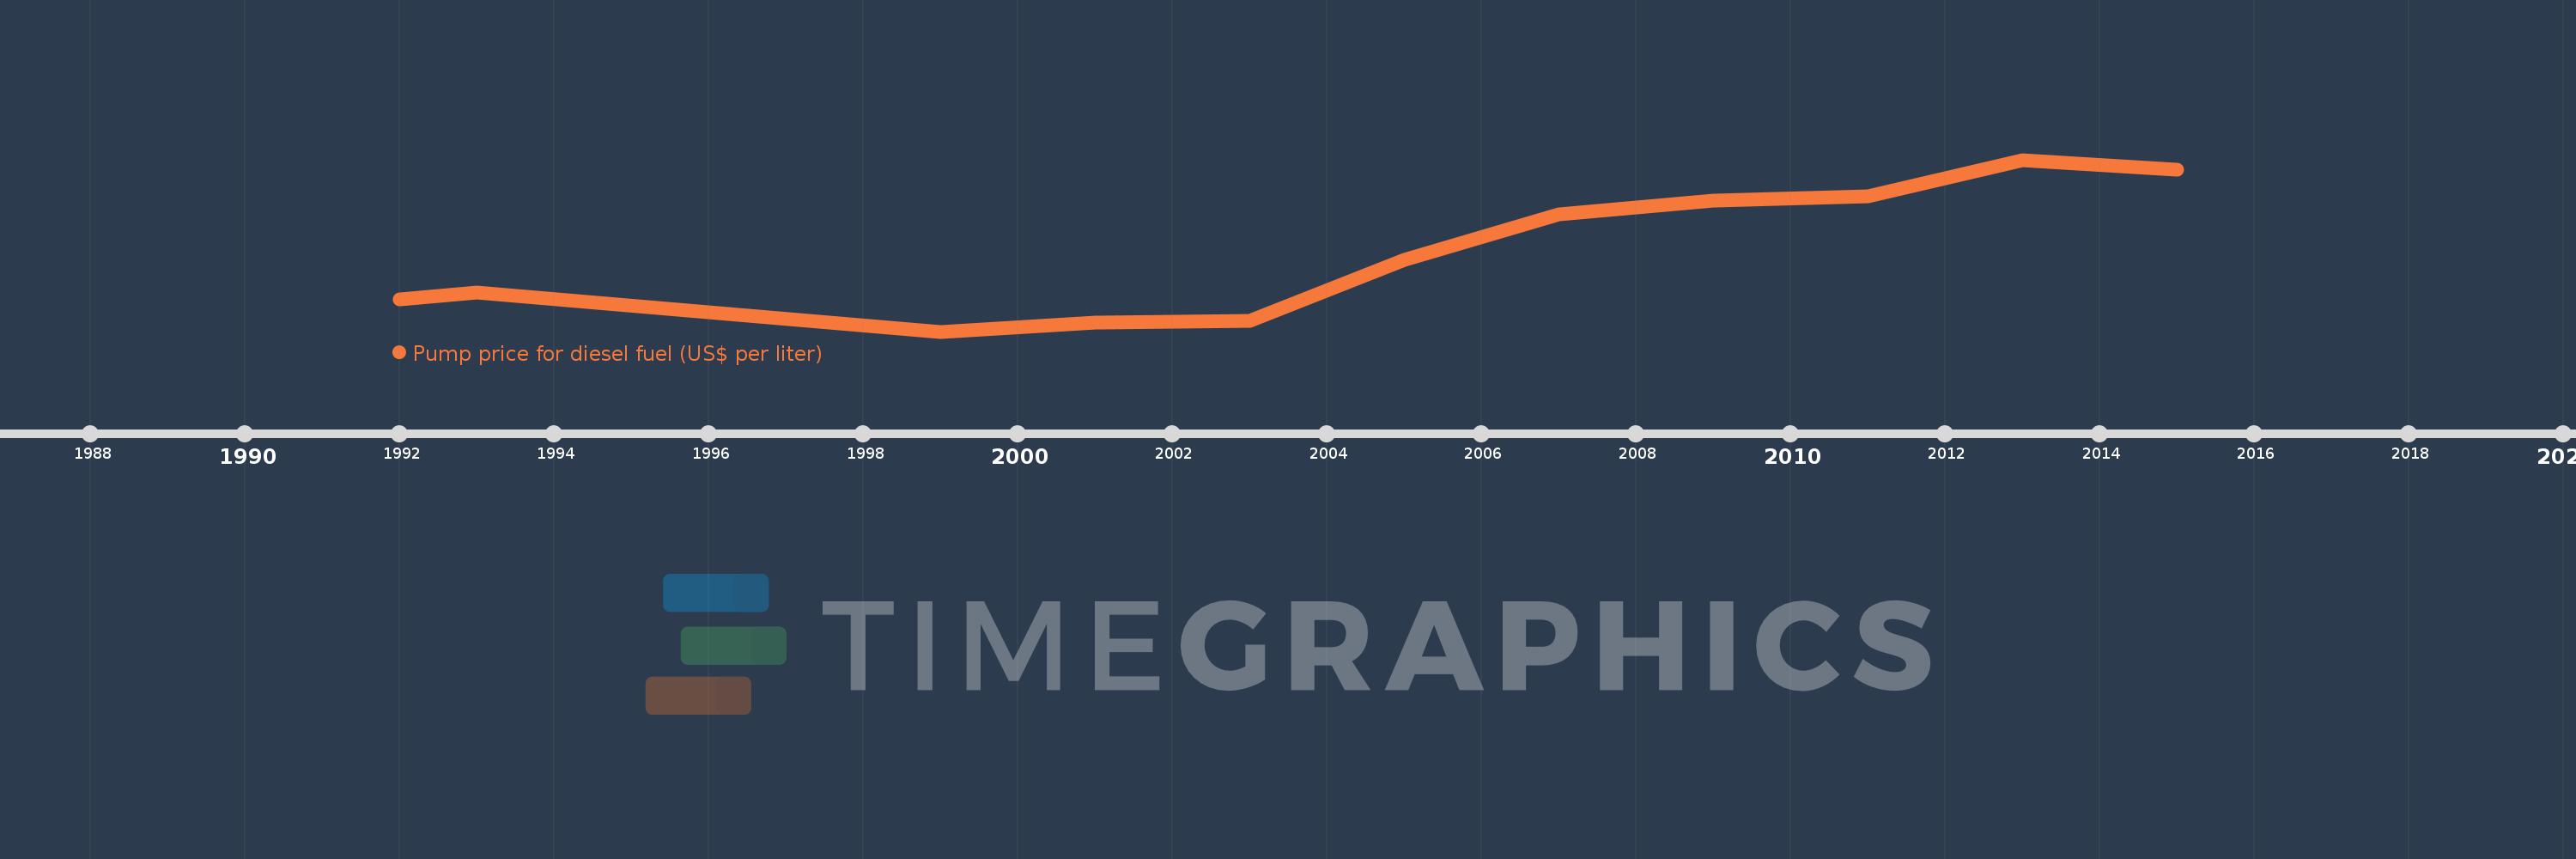
This timeline shows a graph from 1992 to 2015 of Least developed countries: UN classification. No data until 1991. Number of actual observations by date: 11.
Source name:
World Development Indicators
Source organization:
German Agency for International Cooperation (GIZ).
Categories, topics:
Energy & Mining, Urban Development
Last updated:
apr 23, 2017
Indicators value changes by year
Meaning:
0.793
Minimum:
0.395
jan 1, 1999
Maximum:
1.25
jan 1, 2013
At the date of observation
Value
Absolute change
Change from the previous value
jan 1, 1992
0.555
+0.555
0.0%
jan 1, 1993
0.59
+0.035
6.31%
jan 1, 1999
0.395
-0.195
-33.05%
jan 1, 2001
0.44
+0.045
11.39%
jan 1, 2003
0.45
+0.01
2.27%
jan 1, 2005
0.75
+0.3
66.67%
jan 1, 2007
0.98
+0.23
30.67%
jan 1, 2009
1.045
+0.065
6.63%
jan 1, 2011
1.07
+0.025
2.39%
jan 1, 2013
1.25
+0.18
16.82%
jan 1, 2015
1.2
-0.05
-4.0%
Ranking of countries by current statistics by years