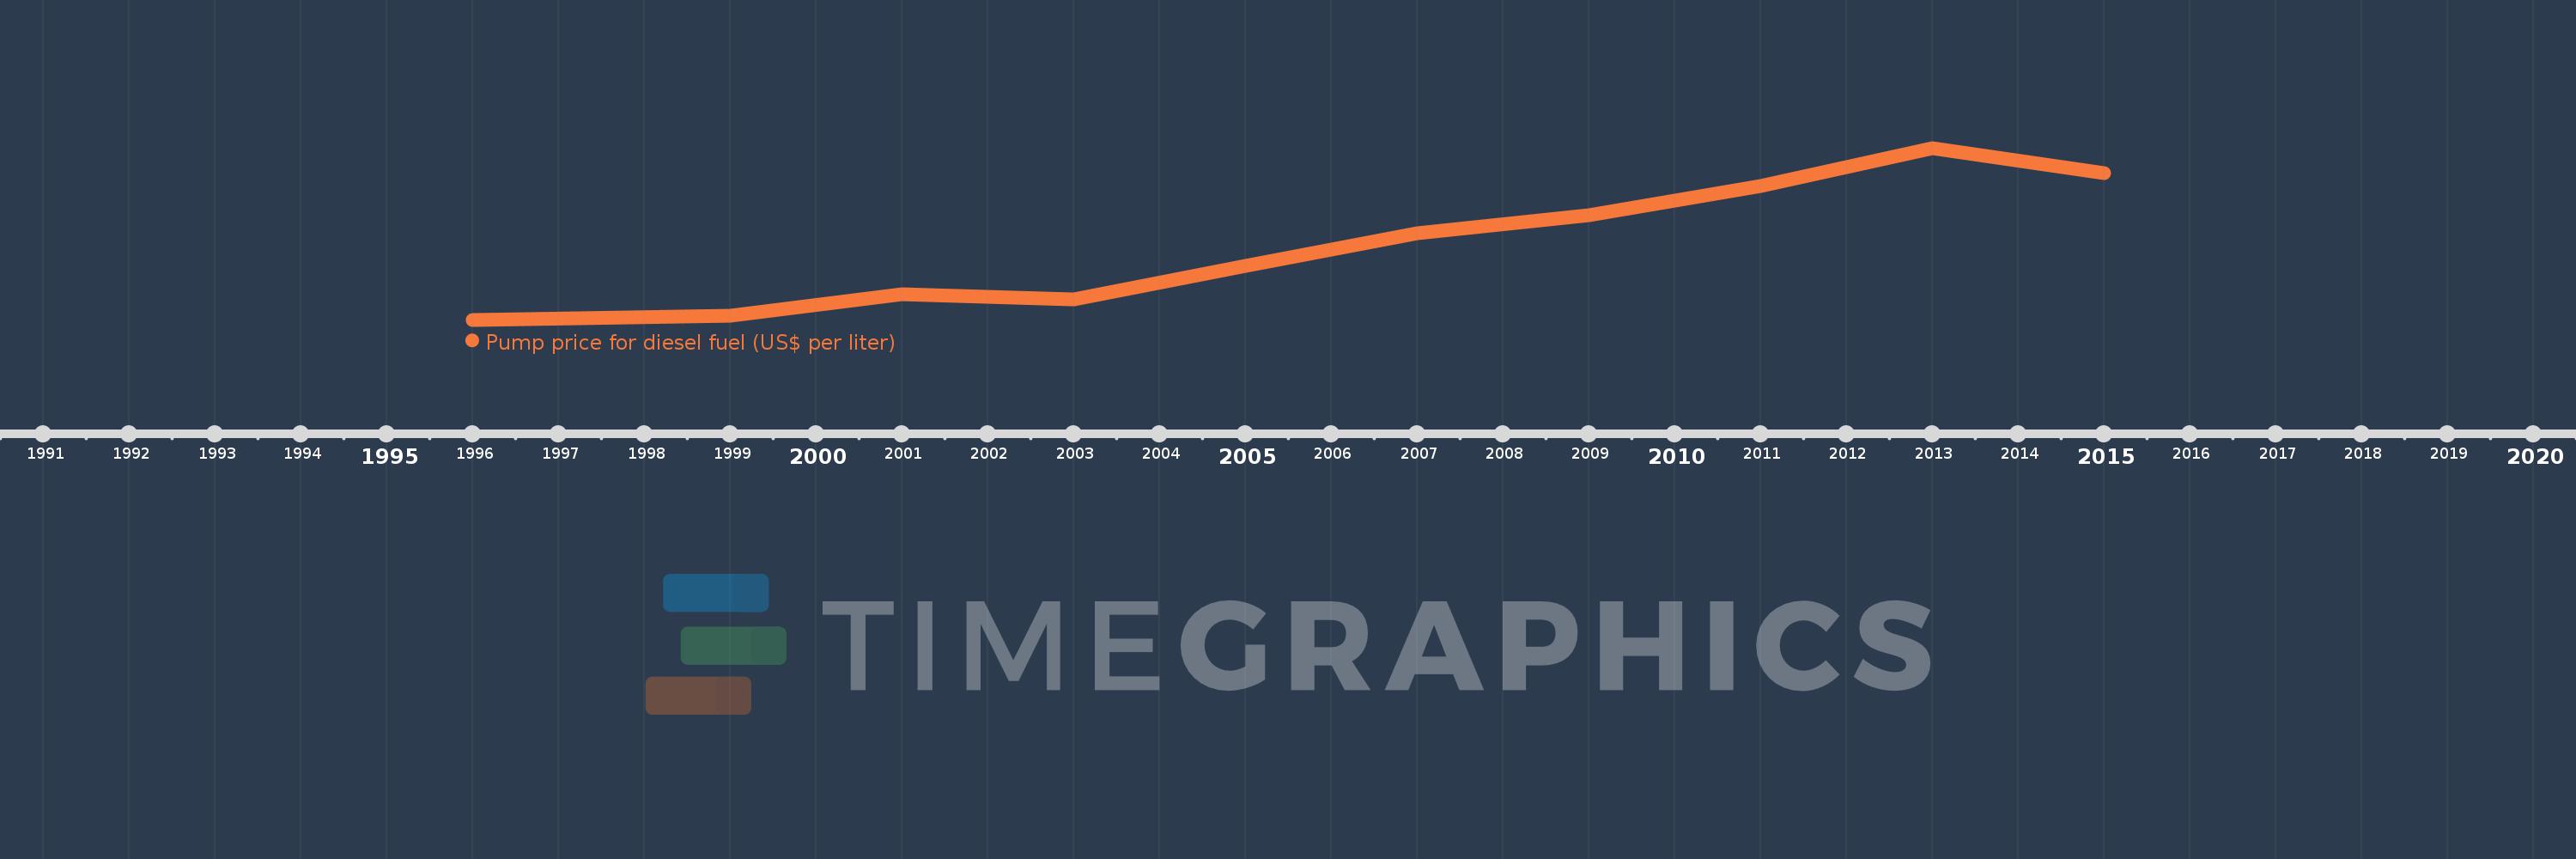
This timeline shows a graph from 1996 to 2015 of Latin America & Caribbean (excluding high income). No data until 1995. Number of actual observations by date: 10.
Source name:
World Development Indicators
Source organization:
German Agency for International Cooperation (GIZ).
Categories, topics:
Energy & Mining, Urban Development
Last updated:
apr 23, 2017
Indicators value changes by year
Meaning:
0.667
Minimum:
0.28
jan 1, 1996
Maximum:
1.17
jan 1, 2013
At the date of observation
Value
Absolute change
Change from the previous value
jan 1, 1996
0.28
+0.28
0.0%
jan 1, 1999
0.3
+0.02
7.14%
jan 1, 2001
0.41
+0.11
36.67%
jan 1, 2003
0.385
-0.025
-6.1%
jan 1, 2005
0.56
+0.175
45.45%
jan 1, 2007
0.73
+0.17
30.36%
jan 1, 2009
0.82
+0.09
12.33%
jan 1, 2011
0.975
+0.155
18.9%
jan 1, 2013
1.17
+0.195
20.0%
jan 1, 2015
1.04
-0.13
-11.11%
Ranking of countries by current statistics by years