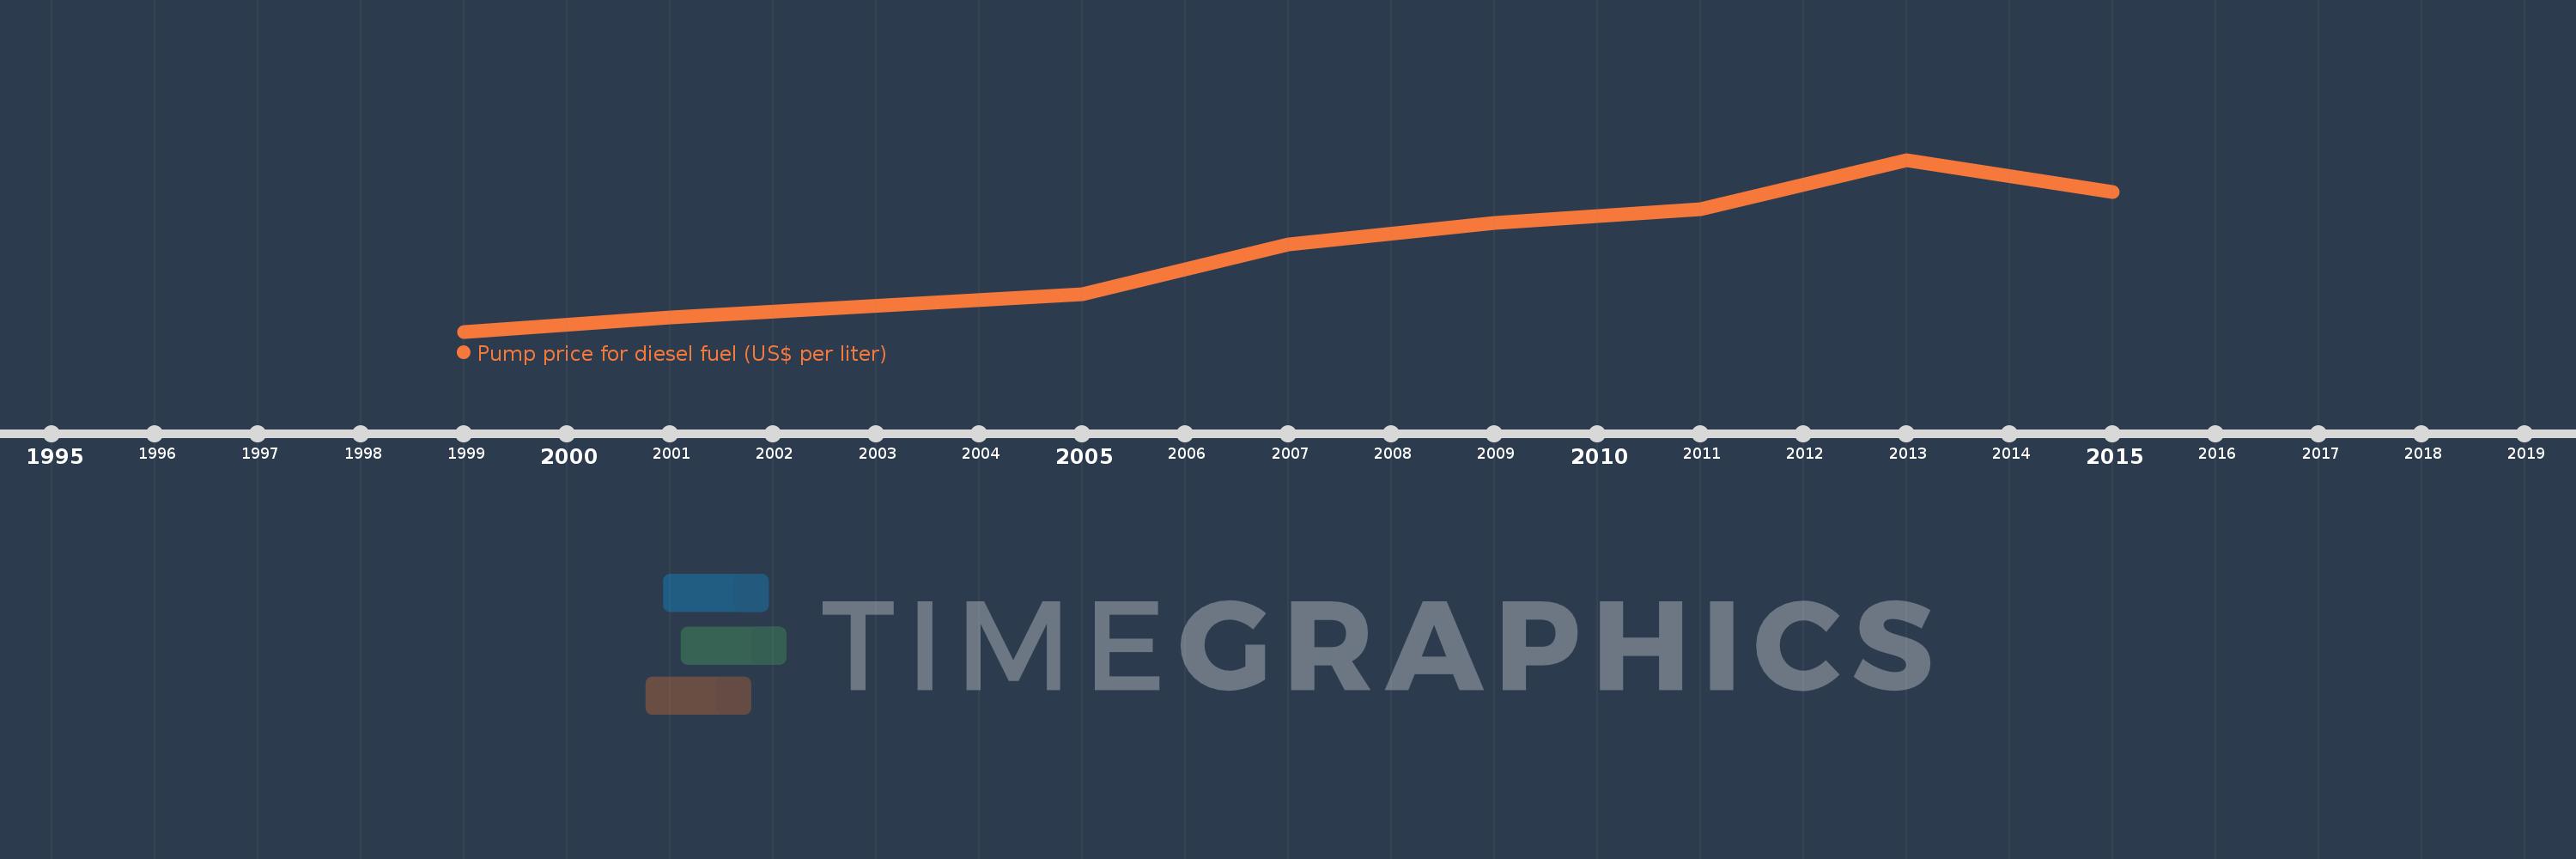
This timeline shows a graph from 1999 to 2015 of East Asia & Pacific (excluding high income). No data until 1998. Number of actual observations by date: 8.
Source name:
World Development Indicators
Source organization:
German Agency for International Cooperation (GIZ).
Categories, topics:
Energy & Mining, Urban Development
Last updated:
apr 23, 2017
Indicators value changes by year
Meaning:
0.72
Minimum:
0.25
jan 1, 1999
Maximum:
1.2
jan 1, 2013
At the date of observation
Value
Absolute change
Change from the previous value
jan 1, 1999
0.25
+0.25
0.0%
jan 1, 2001
0.33
+0.08
32.0%
jan 1, 2005
0.455
+0.125
37.88%
jan 1, 2007
0.73
+0.275
60.44%
jan 1, 2009
0.85
+0.12
16.44%
jan 1, 2011
0.925
+0.075
8.82%
jan 1, 2013
1.2
+0.275
29.73%
jan 1, 2015
1.02
-0.18
-15.0%
Ranking of countries by current statistics by years