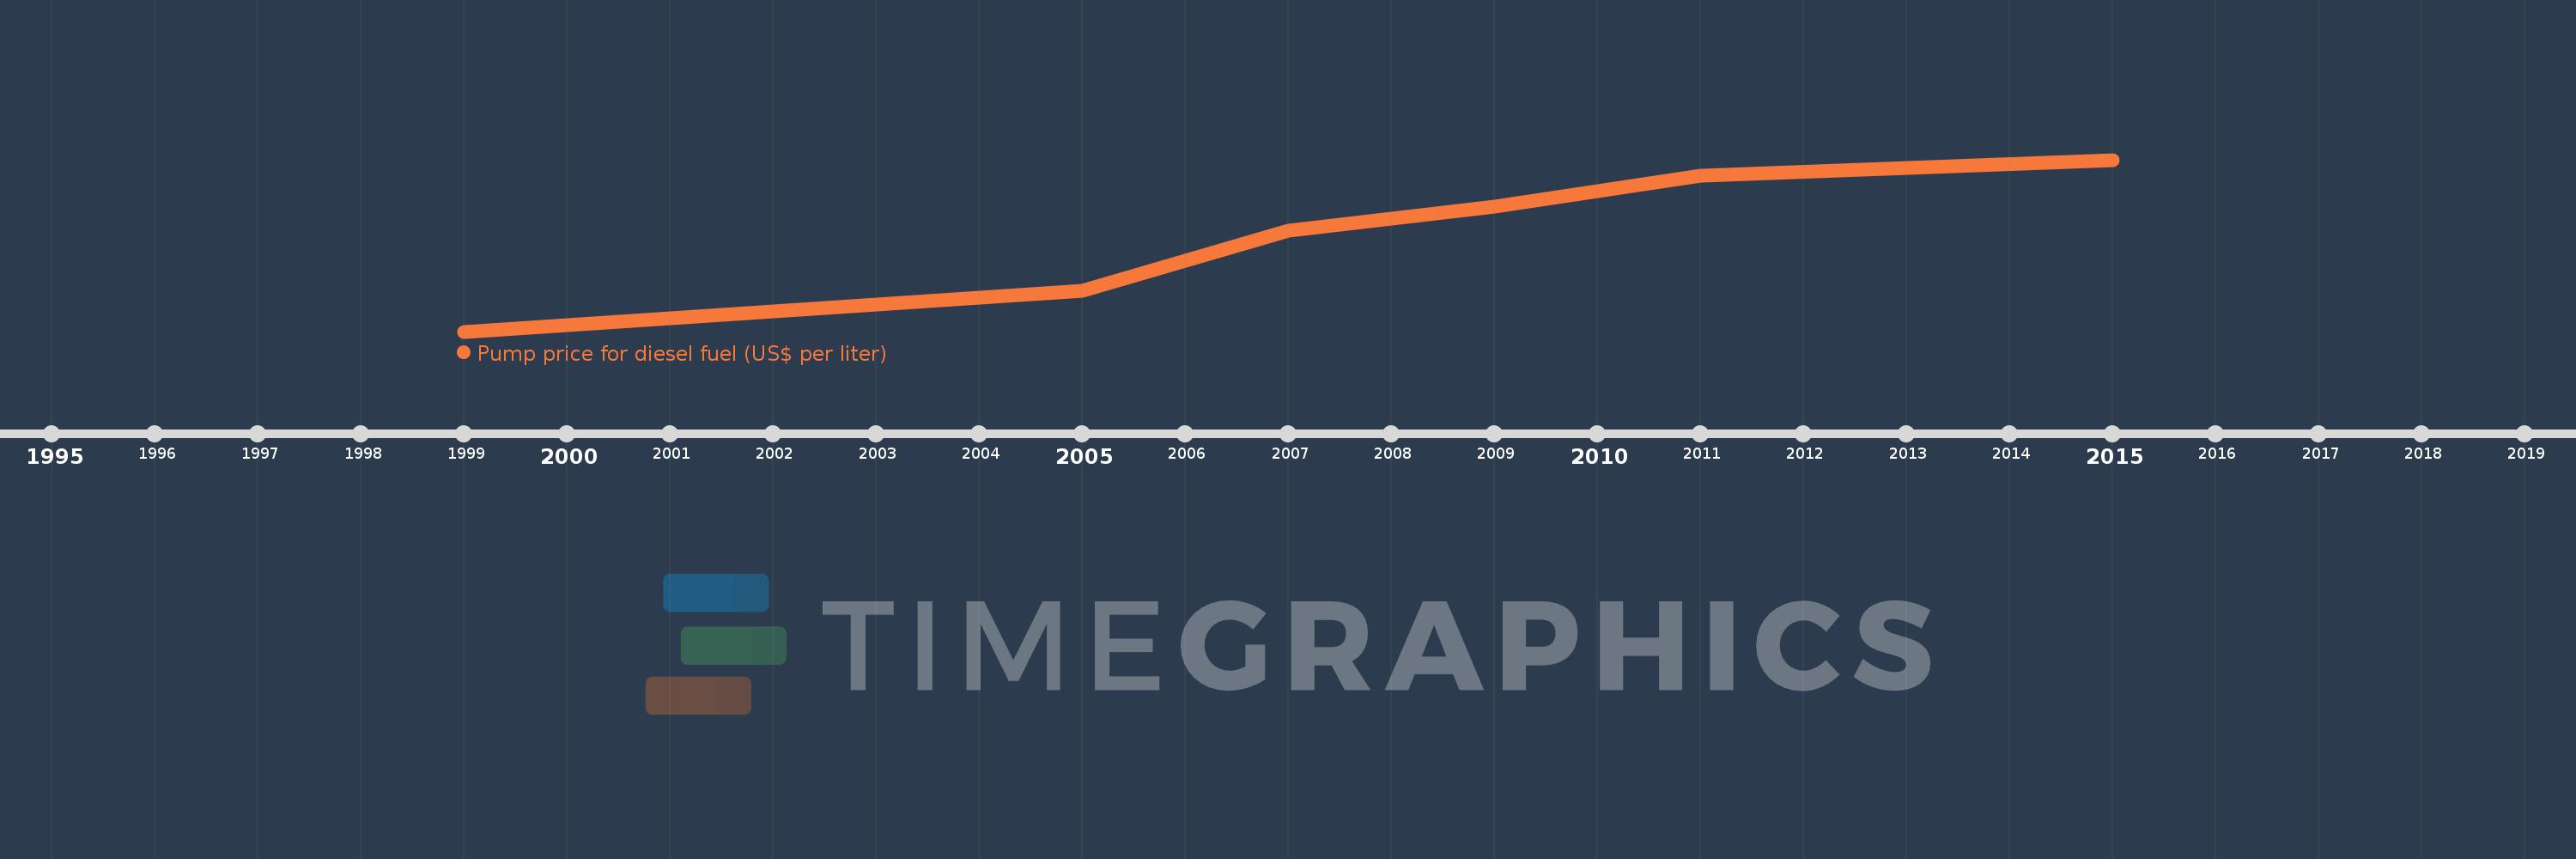
This timeline shows a graph from 1999 to 2015 of East Asia & Pacific (IDA & IBRD countries). No data until 1998. Number of actual observations by date: 6.
Source name:
World Development Indicators
Source organization:
German Agency for International Cooperation (GIZ).
Categories, topics:
Energy & Mining, Urban Development
Last updated:
apr 23, 2017
Indicators value changes by year
Meaning:
0.692
Minimum:
0.245
jan 1, 1999
Maximum:
1.02
jan 1, 2015
At the date of observation
Value
Absolute change
Change from the previous value
jan 1, 1999
0.245
+0.245
0.0%
jan 1, 2005
0.43
+0.185
75.51%
jan 1, 2007
0.7
+0.27
62.79%
jan 1, 2009
0.81
+0.11
15.71%
jan 1, 2011
0.95
+0.14
17.28%
jan 1, 2015
1.02
+0.07
7.37%
Ranking of countries by current statistics by years