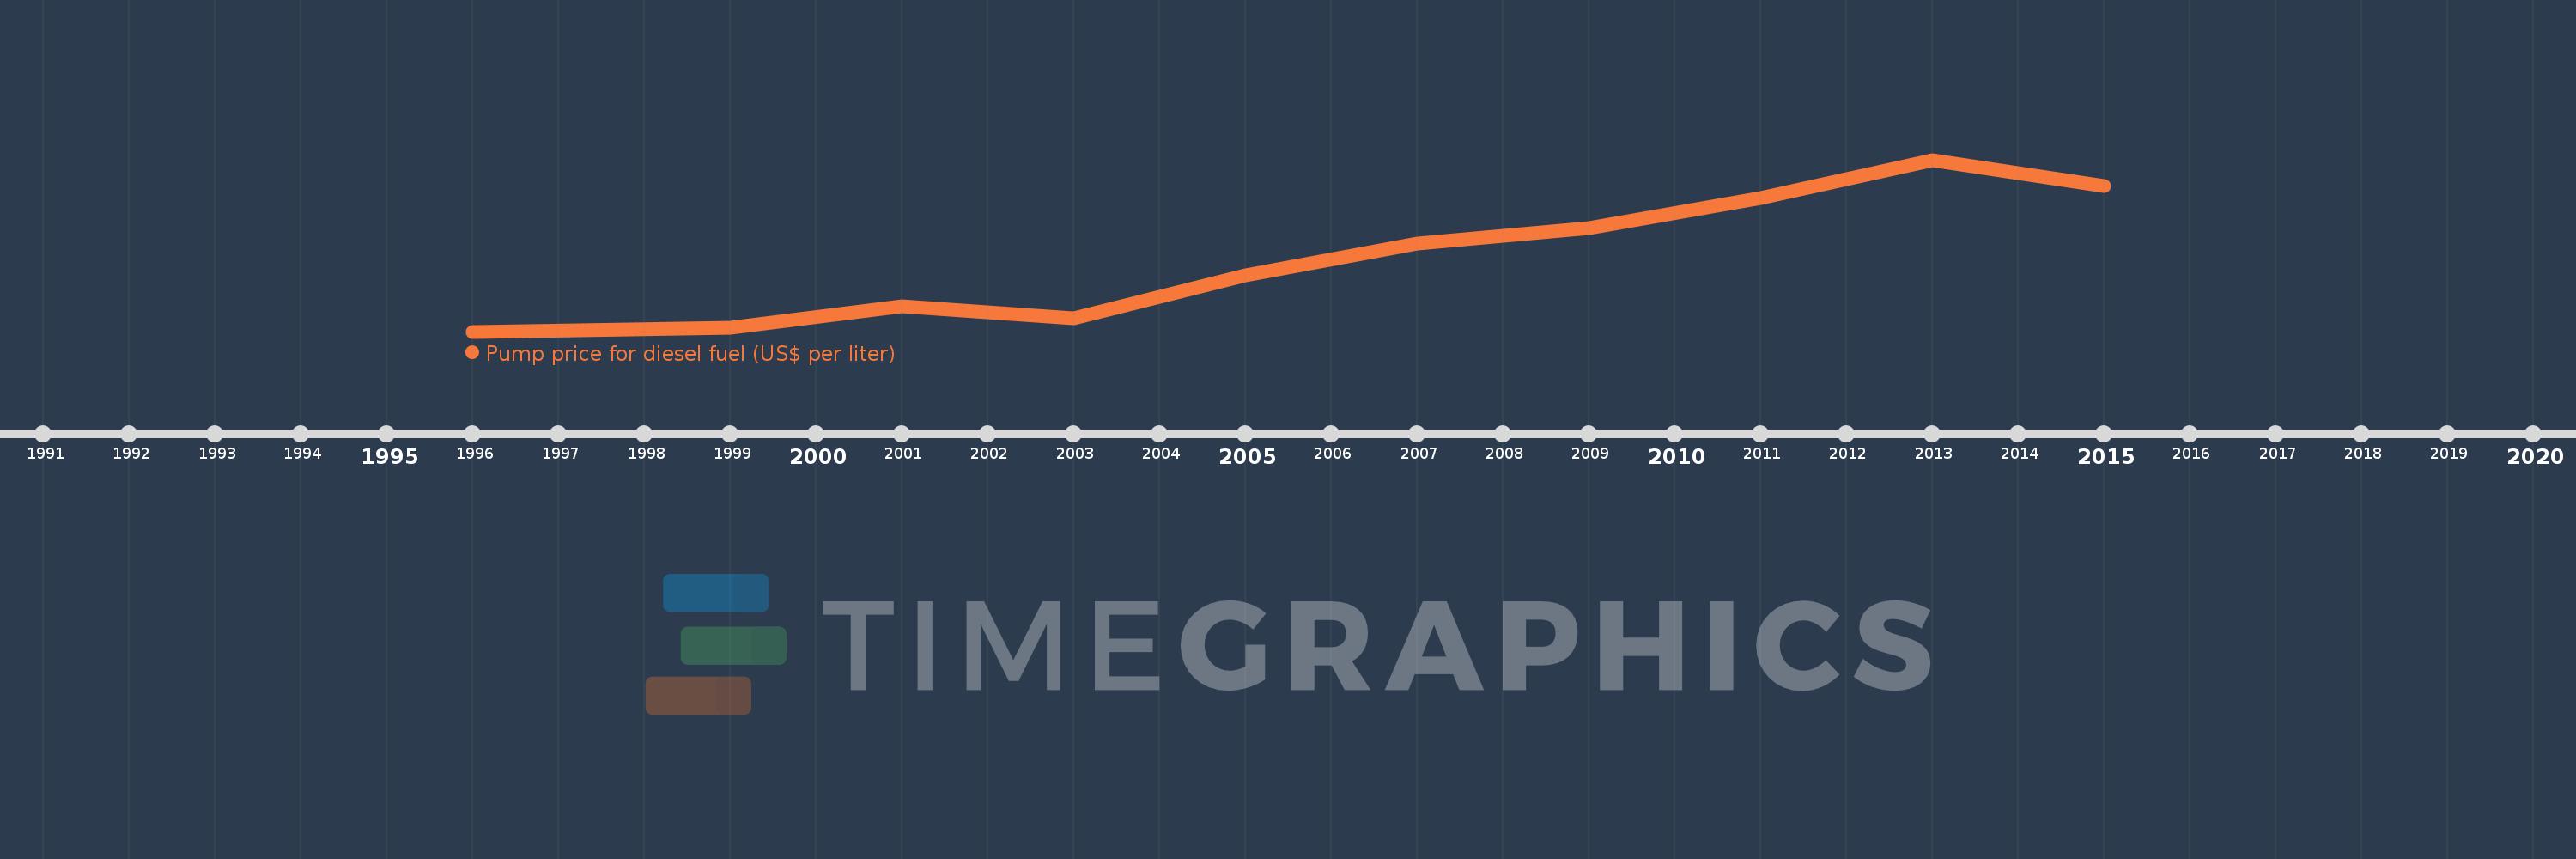
This timeline shows a graph from 1996 to 2015 of Latin America & the Caribbean (IDA & IBRD countries). No data until 1995. Number of actual observations by date: 10.
Source name:
World Development Indicators
Source organization:
German Agency for International Cooperation (GIZ).
Categories, topics:
Energy & Mining, Urban Development
Last updated:
apr 23, 2017
Indicators value changes by year
Meaning:
0.666
Minimum:
0.28
jan 1, 1996
Maximum:
1.175
jan 1, 2013
At the date of observation
Value
Absolute change
Change from the previous value
jan 1, 1996
0.28
+0.28
0.0%
jan 1, 1999
0.3
+0.02
7.14%
jan 1, 2001
0.41
+0.11
36.67%
jan 1, 2003
0.35
-0.06
-14.63%
jan 1, 2005
0.575
+0.225
64.29%
jan 1, 2007
0.74
+0.165
28.7%
jan 1, 2009
0.82
+0.08
10.81%
jan 1, 2011
0.975
+0.155
18.9%
jan 1, 2013
1.175
+0.2
20.51%
jan 1, 2015
1.04
-0.135
-11.49%
Ranking of countries by current statistics by years