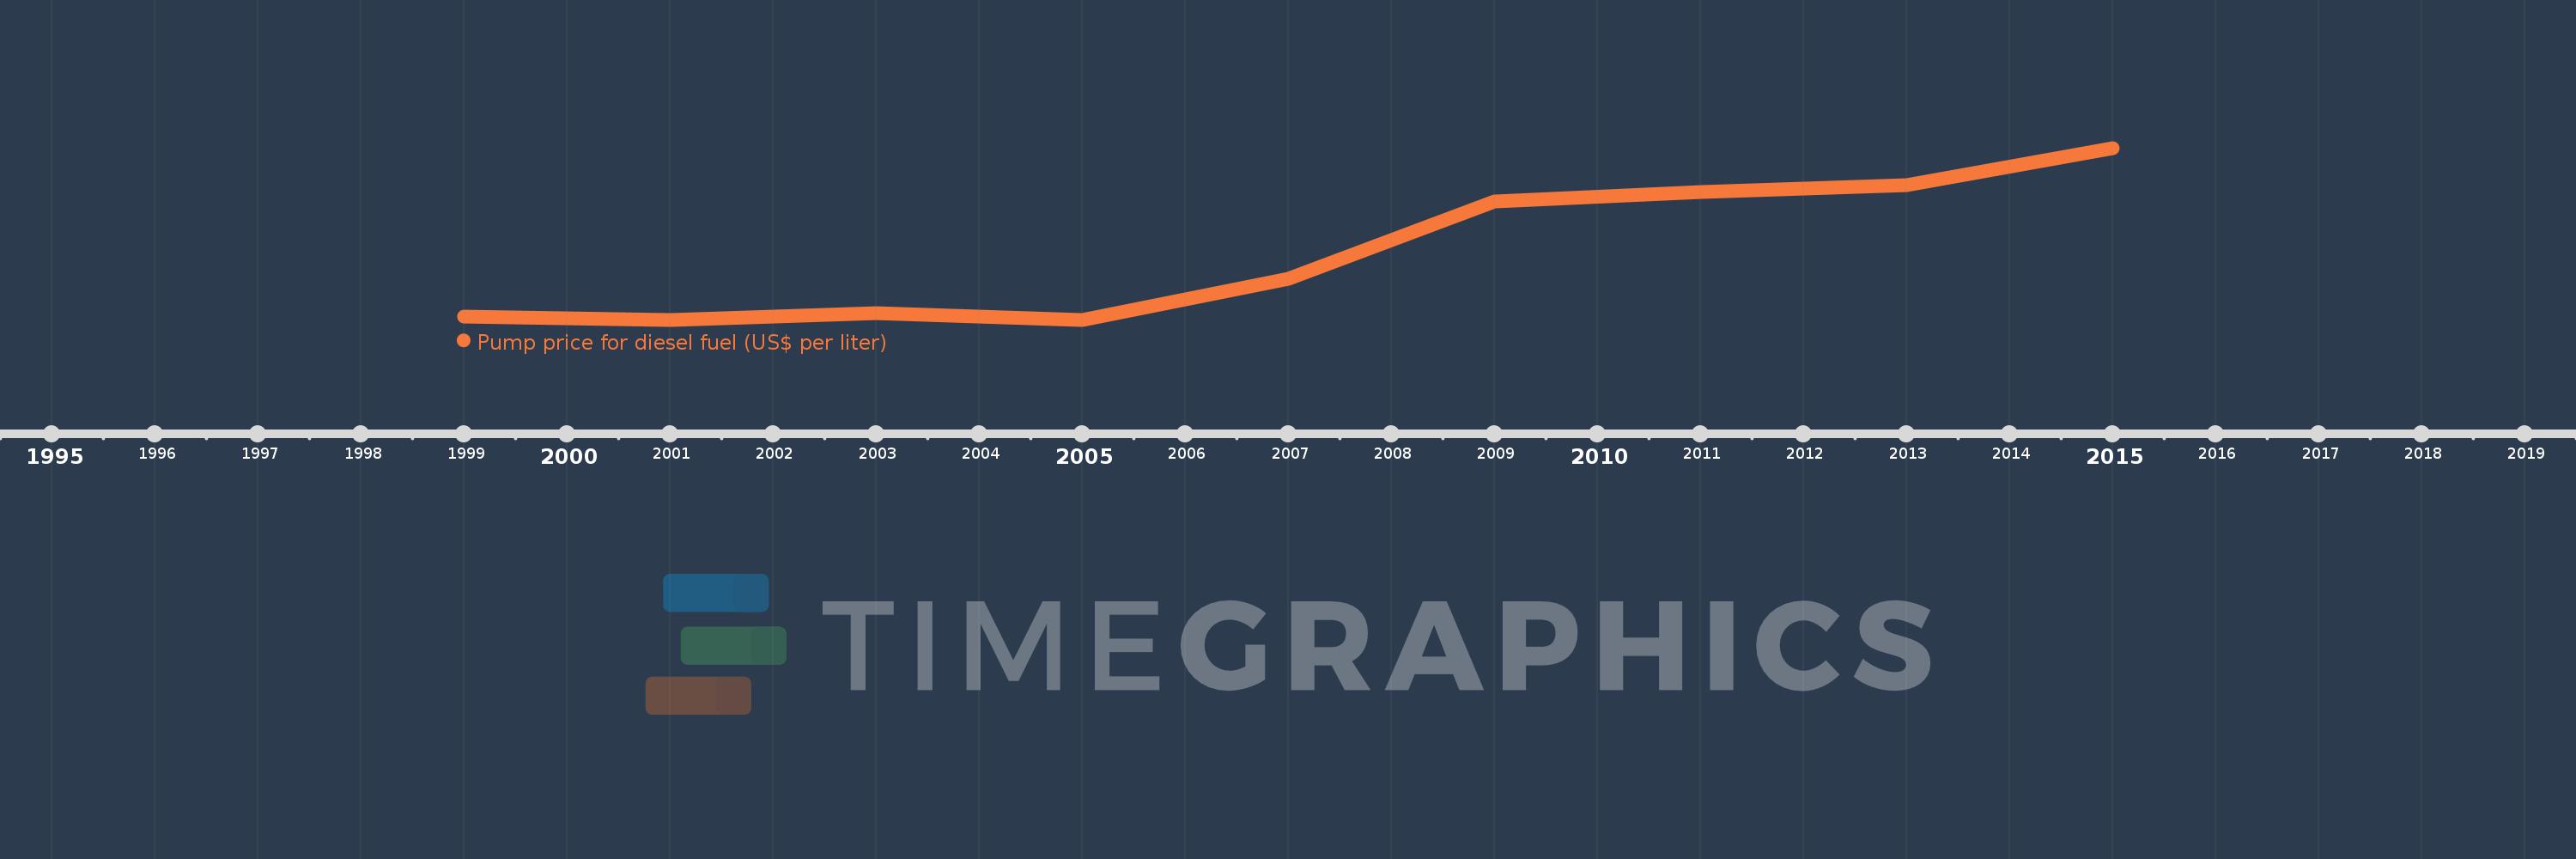
This timeline shows a graph from 1999 to 2015 of Middle East & North Africa (excluding high income). No data until 1998. Number of actual observations by date: 9.
Source name:
World Development Indicators
Source organization:
German Agency for International Cooperation (GIZ).
Categories, topics:
Energy & Mining, Urban Development
Last updated:
apr 23, 2017
Indicators value changes by year
Meaning:
0.364
Minimum:
0.15
jan 1, 2001
Maximum:
0.7
jan 1, 2015
At the date of observation
Value
Absolute change
Change from the previous value
jan 1, 1999
0.16
+0.16
0.0%
jan 1, 2001
0.15
-0.01
-6.25%
jan 1, 2003
0.17
+0.02
13.33%
jan 1, 2005
0.15
-0.02
-11.76%
jan 1, 2007
0.28
+0.13
86.67%
jan 1, 2009
0.53
+0.25
89.29%
jan 1, 2011
0.56
+0.03
5.66%
jan 1, 2013
0.58
+0.02
3.57%
jan 1, 2015
0.7
+0.12
20.69%
Ranking of countries by current statistics by years