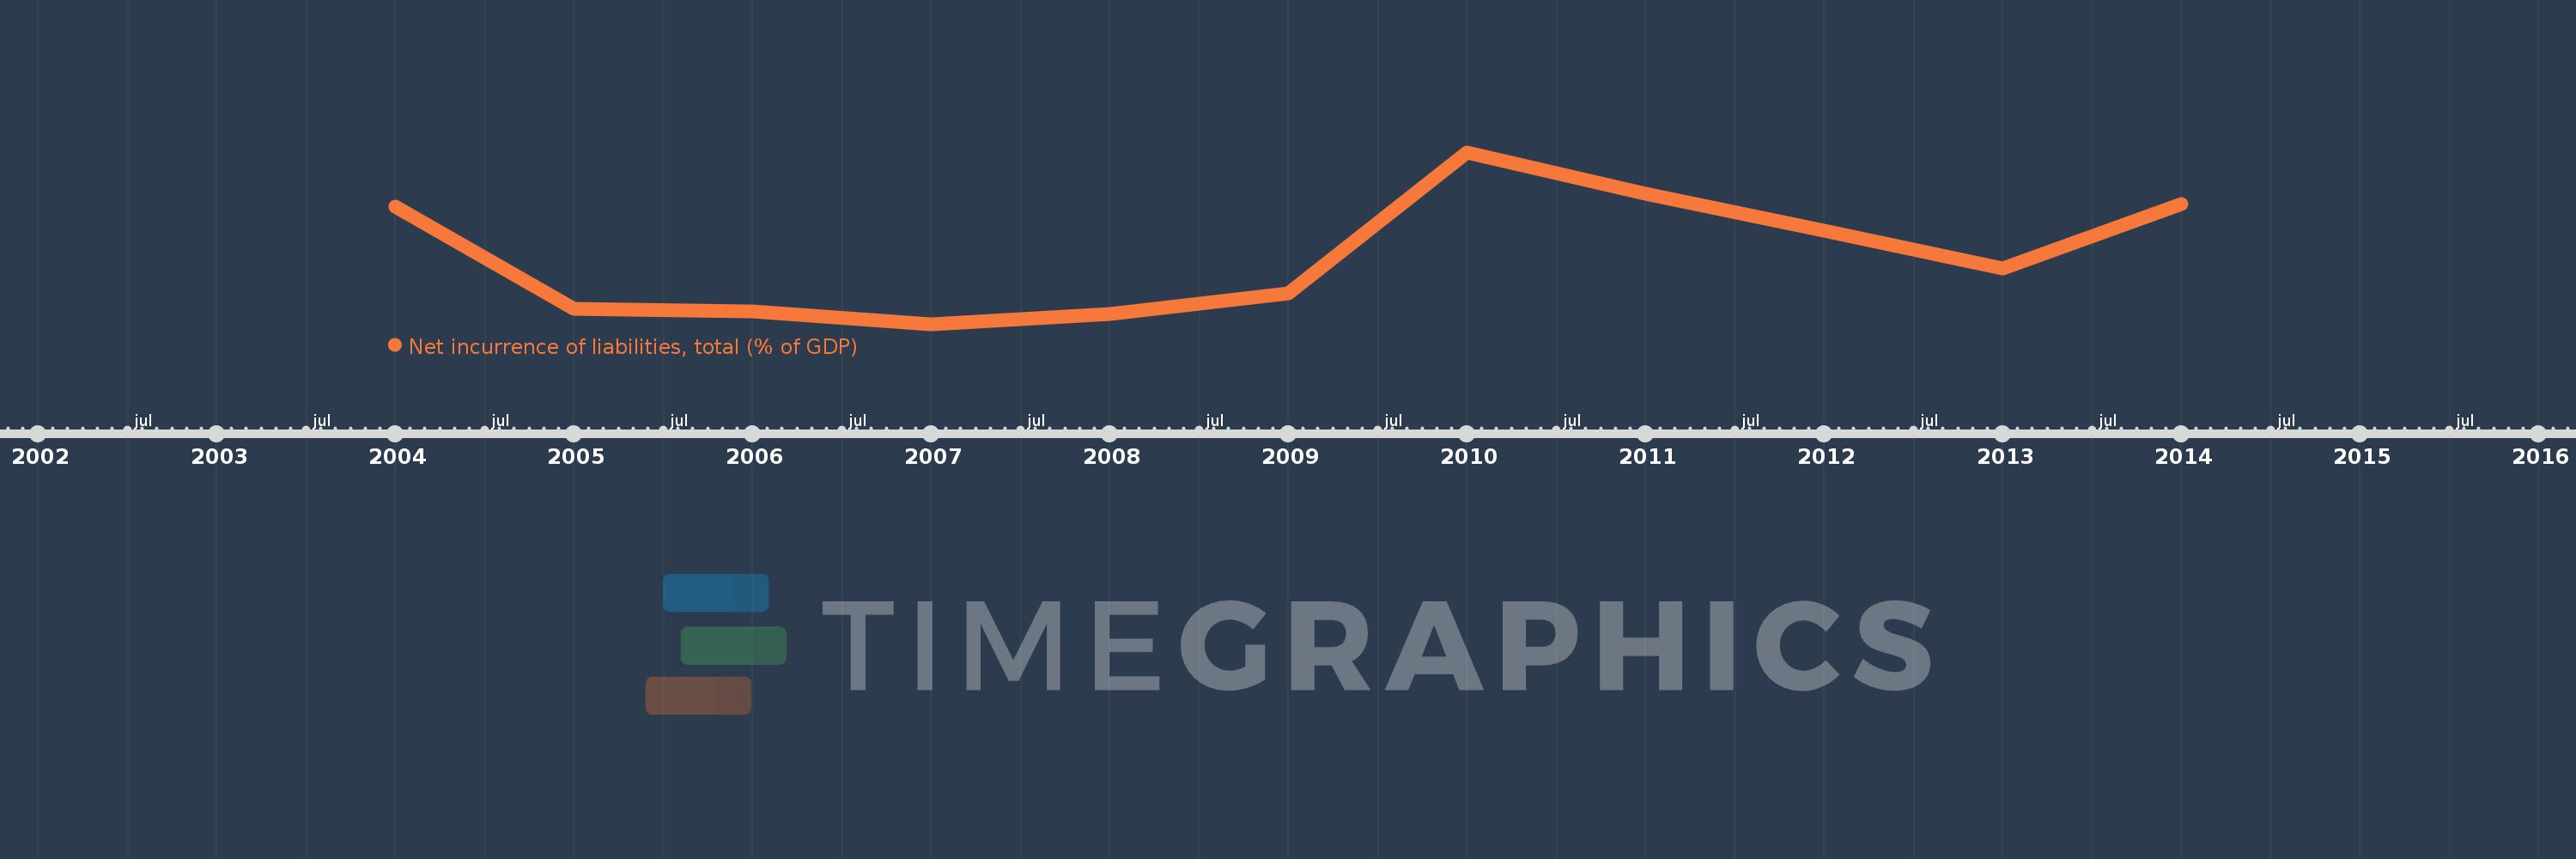
This timeline shows a graph from 2004 to 2014 of Sub-Saharan Africa (excluding high income). No data until 2003. Number of actual observations by date: 11.
Source name:
World Development Indicators
Source organization:
International Monetary Fund, Government Finance Statistics Yearbook and data files.
Categories, topics:
Public Sector
Last updated:
apr 23, 2017
Indicators value changes by year
Meaning:
3.067
Minimum:
1.599
jan 1, 2007
Maximum:
5.254
jan 1, 2010
At the date of observation
Value
Absolute change
Change from the previous value
jan 1, 2004
4.094
+4.094
0.0%
jan 1, 2005
1.932
-2.162
-52.81%
jan 1, 2006
1.878
-0.053
-2.77%
jan 1, 2007
1.599
-0.279
-14.85%
jan 1, 2008
1.815
+0.216
13.49%
jan 1, 2009
2.249
+0.434
23.92%
jan 1, 2010
5.254
+3.004
133.55%
jan 1, 2011
4.375
-0.879
-16.73%
jan 1, 2012
3.595
-0.78
-17.83%
jan 1, 2013
2.788
-0.807
-22.44%
jan 1, 2014
4.157
+1.369
49.09%
Ranking of countries by current statistics by years