Download This statistics in other country:
Timeline:
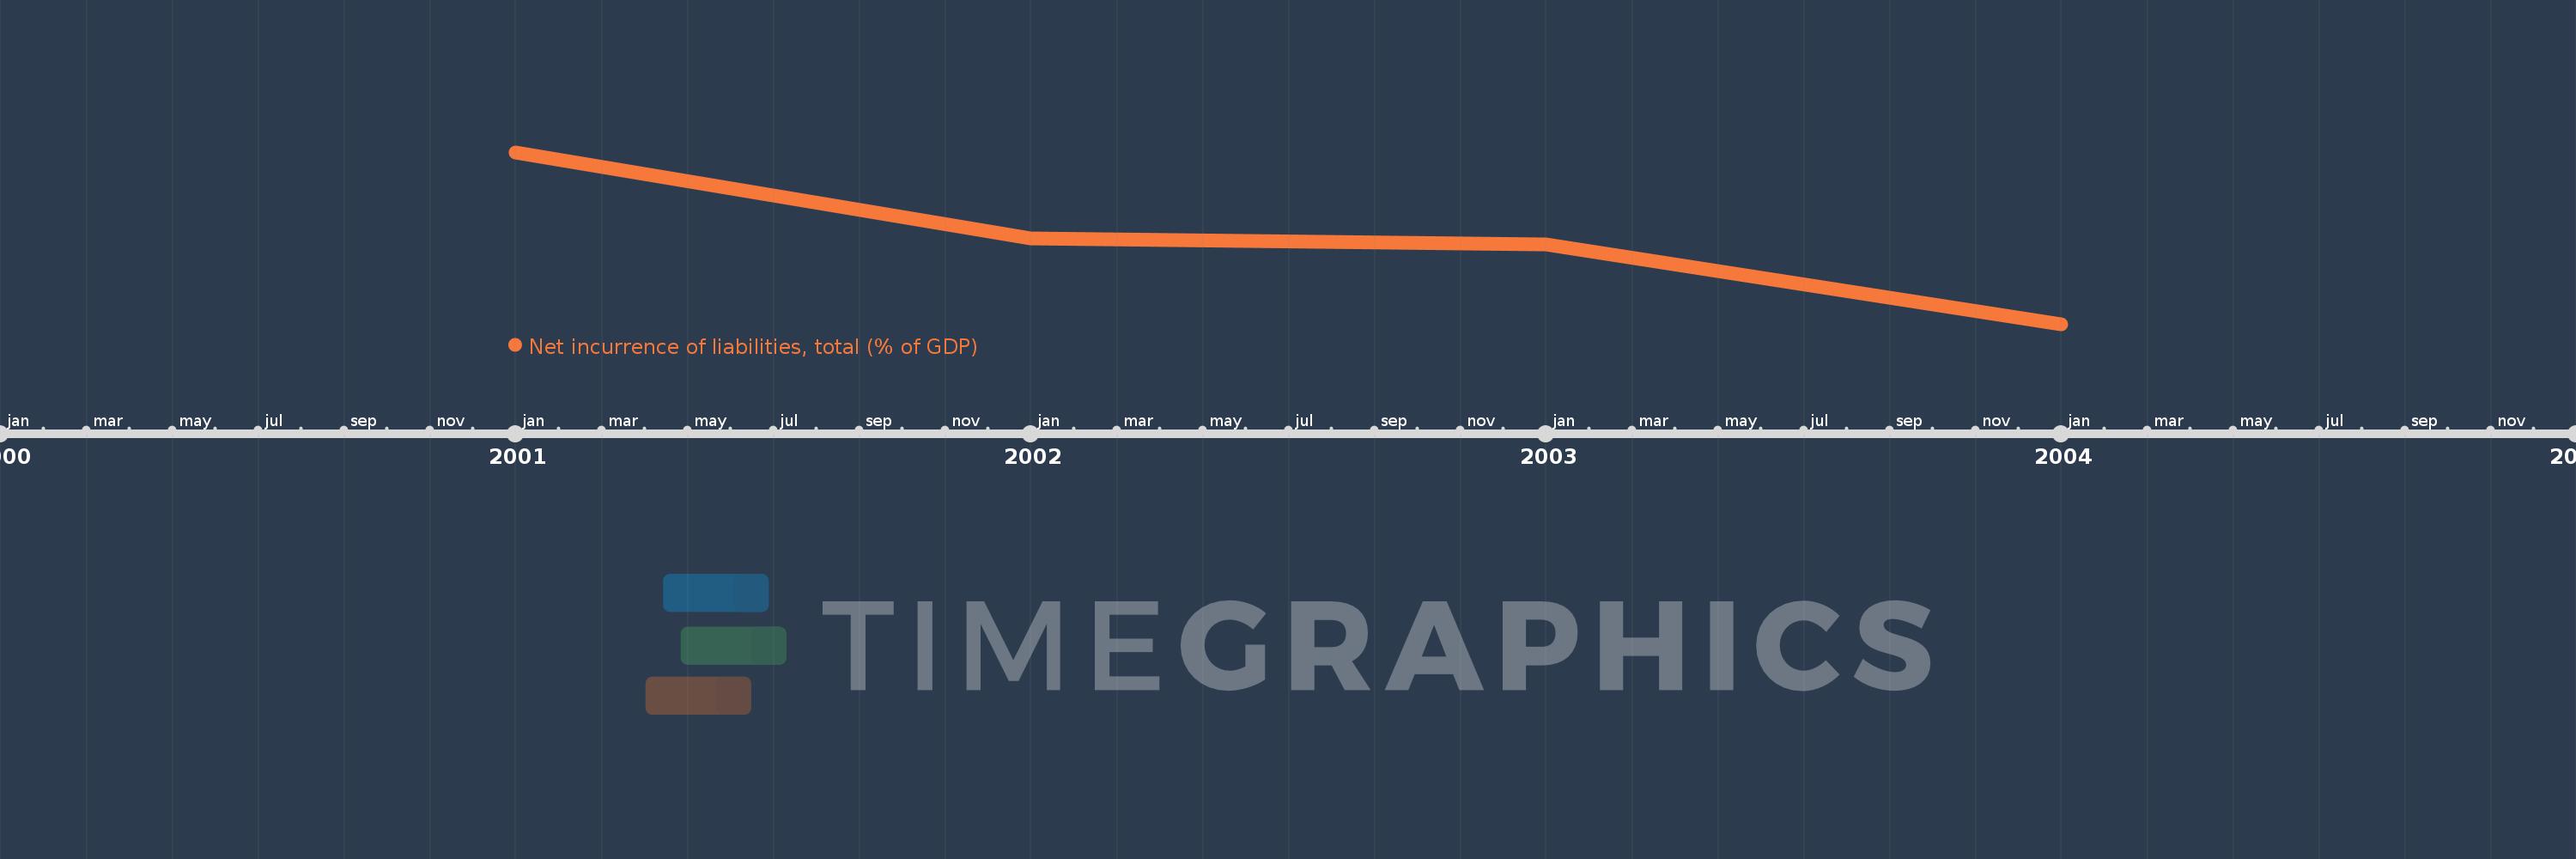
This timeline shows a graph from 2001 to 2004 of Lithuania. No data until 2000. Number of actual observations by date: 4.
Source name:
World Development Indicators
Source organization:
International Monetary Fund, Government Finance Statistics Yearbook and data files.
Categories, topics:
Public Sector
Last updated:
apr 23, 2017
Indicators value changes by year
At the date of observation
Value
Absolute change
Change from the previous value
jan 1, 2001
3.798
+3.798
0.0%
jan 1, 2002
1.942
-1.856
-48.88%
jan 1, 2003
1.819
-0.123
-6.31%
jan 1, 2004
0.095
-1.724
-94.78%
Ranking of countries by current statistics by years