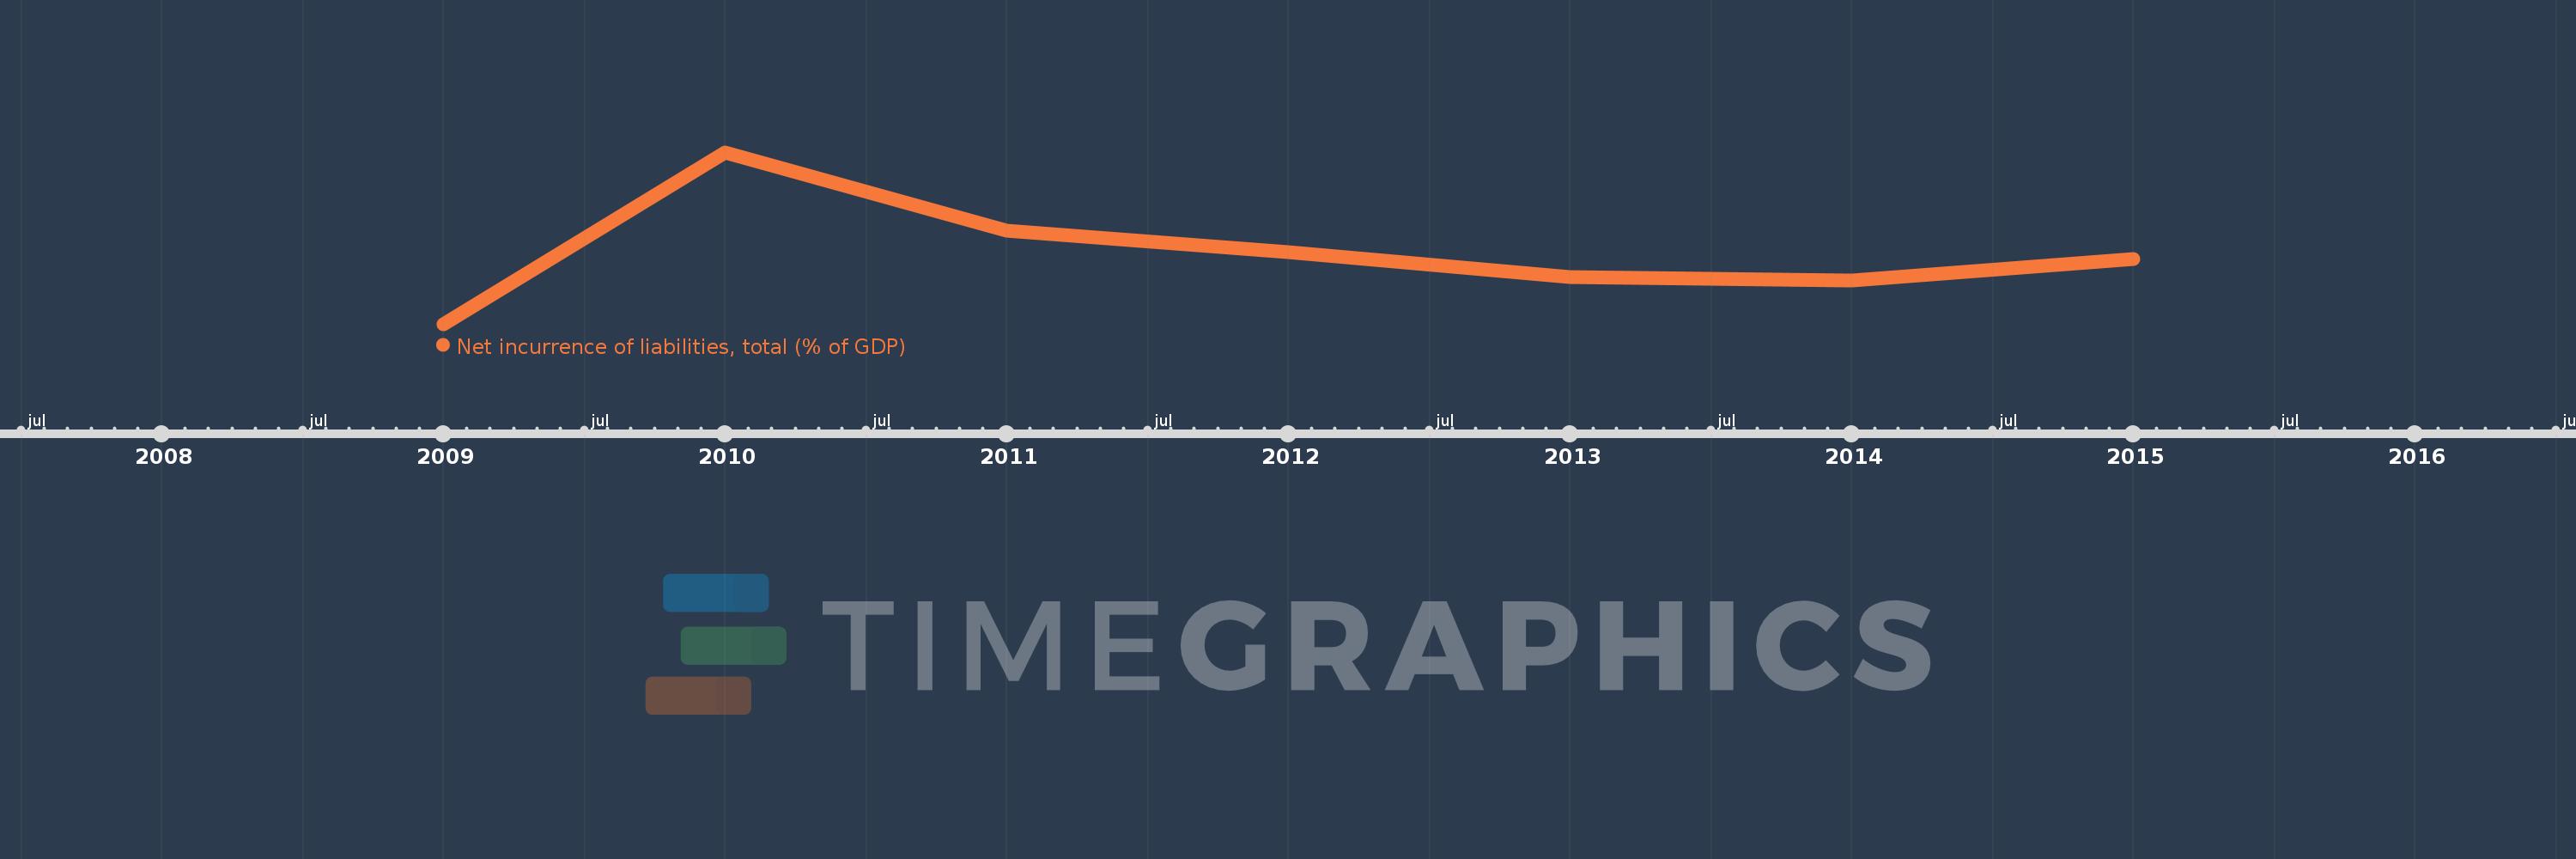
This timeline shows a graph from 2009 to 2015 of Europe & Central Asia (excluding high income). No data until 2008. Number of actual observations by date: 7.
Source name:
World Development Indicators
Source organization:
International Monetary Fund, Government Finance Statistics Yearbook and data files.
Categories, topics:
Public Sector
Last updated:
apr 23, 2017
Indicators value changes by year
Meaning:
2.137
Minimum:
0.708
jan 1, 2009
Maximum:
4.196
jan 1, 2010
At the date of observation
Value
Absolute change
Change from the previous value
jan 1, 2009
0.708
+0.708
0.0%
jan 1, 2010
4.196
+3.488
492.61%
jan 1, 2011
2.613
-1.584
-37.74%
jan 1, 2012
2.167
-0.445
-17.05%
jan 1, 2013
1.666
-0.501
-23.11%
jan 1, 2014
1.587
-0.079
-4.74%
jan 1, 2015
2.023
+0.436
27.45%
Ranking of countries by current statistics by years