29
/
en
AIzaSyAYiBZKx7MnpbEhh9jyipgxe19OcubqV5w
April 1, 2024
55023
Post-demographic dividend
PST
false
2
1
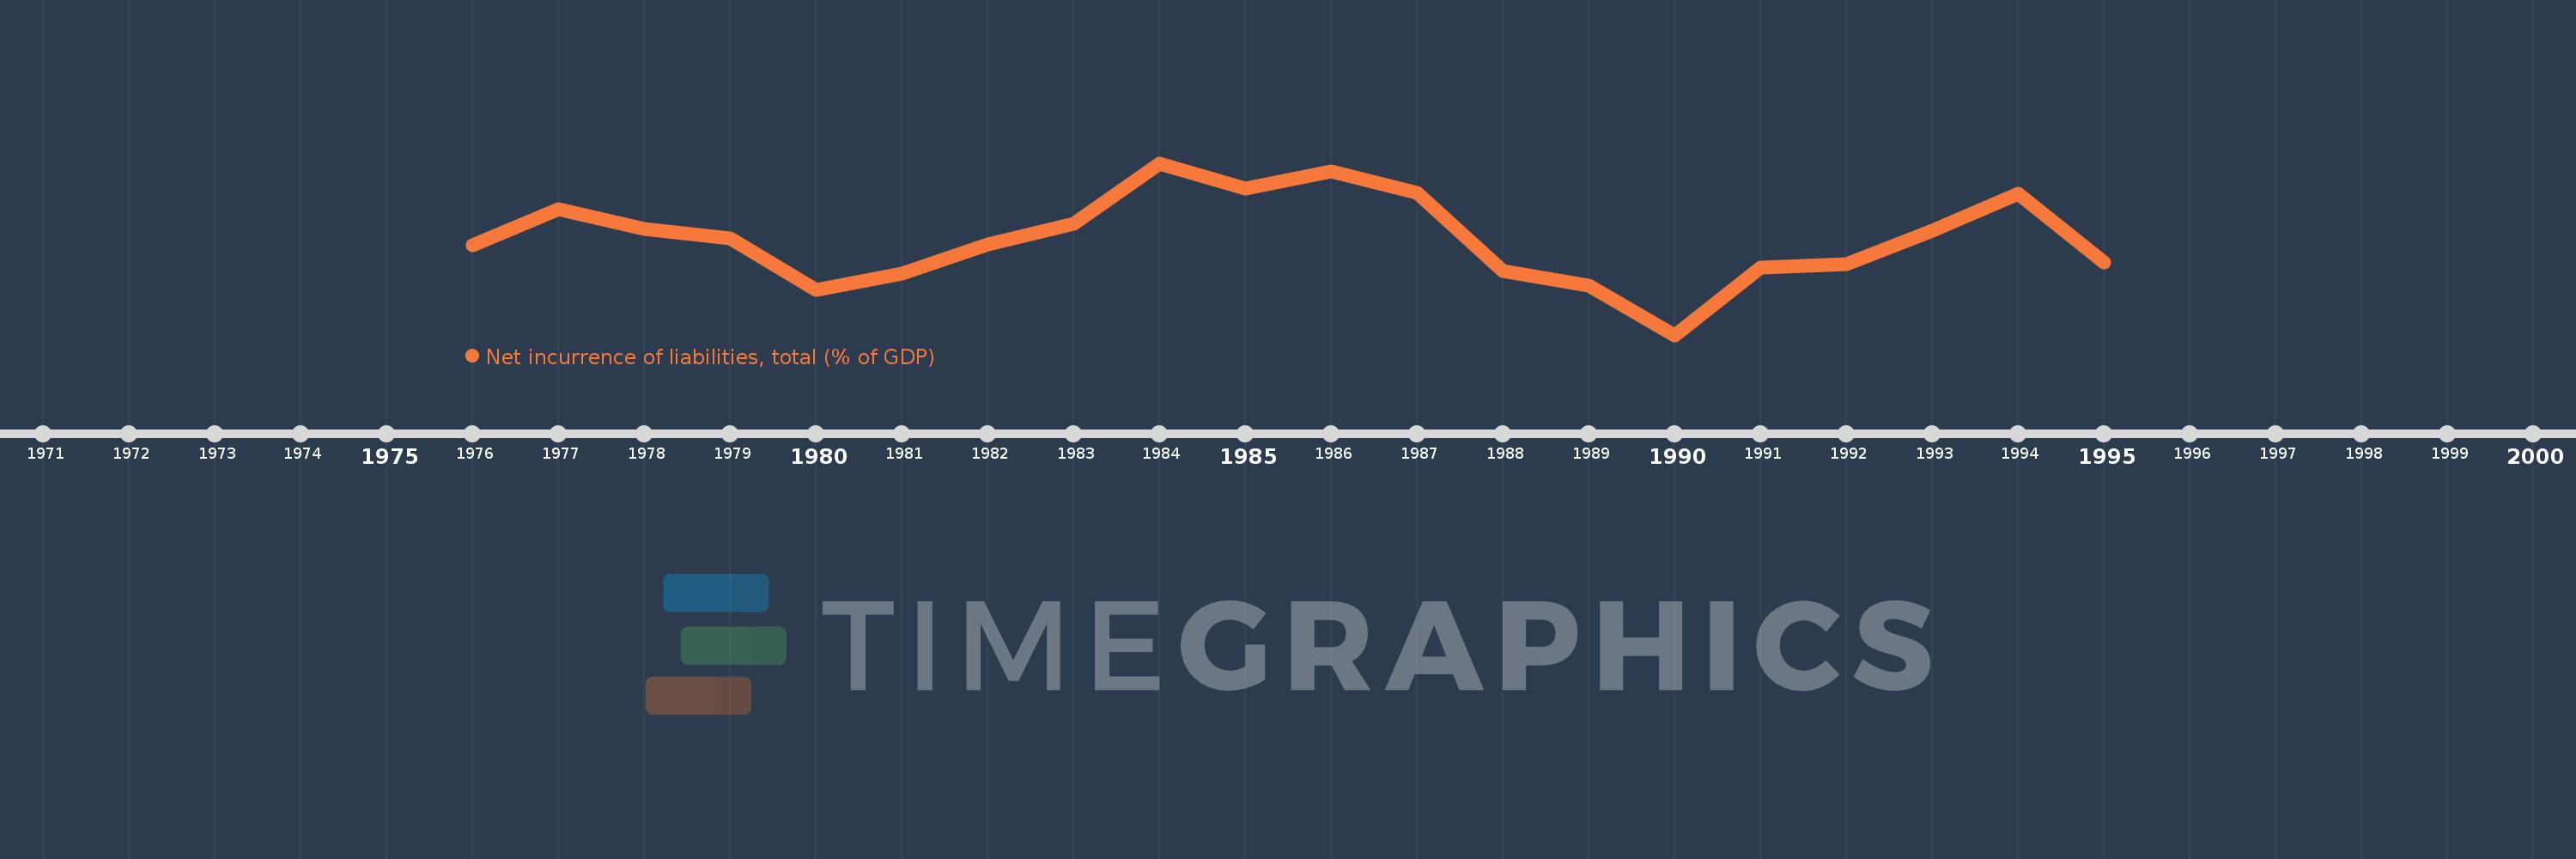
Net incurrence of liabilities, total (% of GDP)
1995,1994,1993,1992,1991,1990,1989,1988,1987,1986,1985,1984,1983,1982,1981,1980,1979,1978,1977,1976
This statistics in other country:
Timeline:
This timeline shows a graph from 1976 to 1995 of Post-demographic dividend. No data until 1975. Number of actual observations by date: 20.
Source name:
World Development Indicators
Source organization:
International Monetary Fund, Government Finance Statistics Yearbook and data files.
Categories, topics:
Public Sector
Last updated:
apr 23, 2017
Indicators value changes by year
At the date of observation
Value
Absolute change
Change from previous value
jan 1, 1976
3.265
+3.265
0.0%
jan 1, 1977
3.873
+0.608
18.63%
jan 1, 1978
3.539
-0.334
-8.61%
jan 1, 1979
3.387
-0.152
-4.29%
jan 1, 1980
2.507
-0.881
-25.99%
jan 1, 1981
2.782
+0.275
10.95%
jan 1, 1982
3.275
+0.493
17.73%
jan 1, 1983
3.638
+0.364
11.11%
jan 1, 1984
4.657
+1.019
28.0%
jan 1, 1985
4.232
-0.425
-9.13%
jan 1, 1986
4.517
+0.285
6.73%
jan 1, 1987
4.153
-0.364
-8.07%
jan 1, 1988
2.824
-1.329
-32.01%
jan 1, 1989
2.584
-0.24
-8.48%
jan 1, 1990
1.747
-0.837
-32.39%
jan 1, 1991
2.882
+1.135
64.95%
jan 1, 1992
2.943
+0.061
2.13%
jan 1, 1993
3.511
+0.568
19.29%
jan 1, 1994
4.142
+0.631
17.96%
jan 1, 1995
2.982
-1.16
-28.0%
Ranking of countries by current statistics by years
Comments: