Download This statistics in other country:
Timeline:
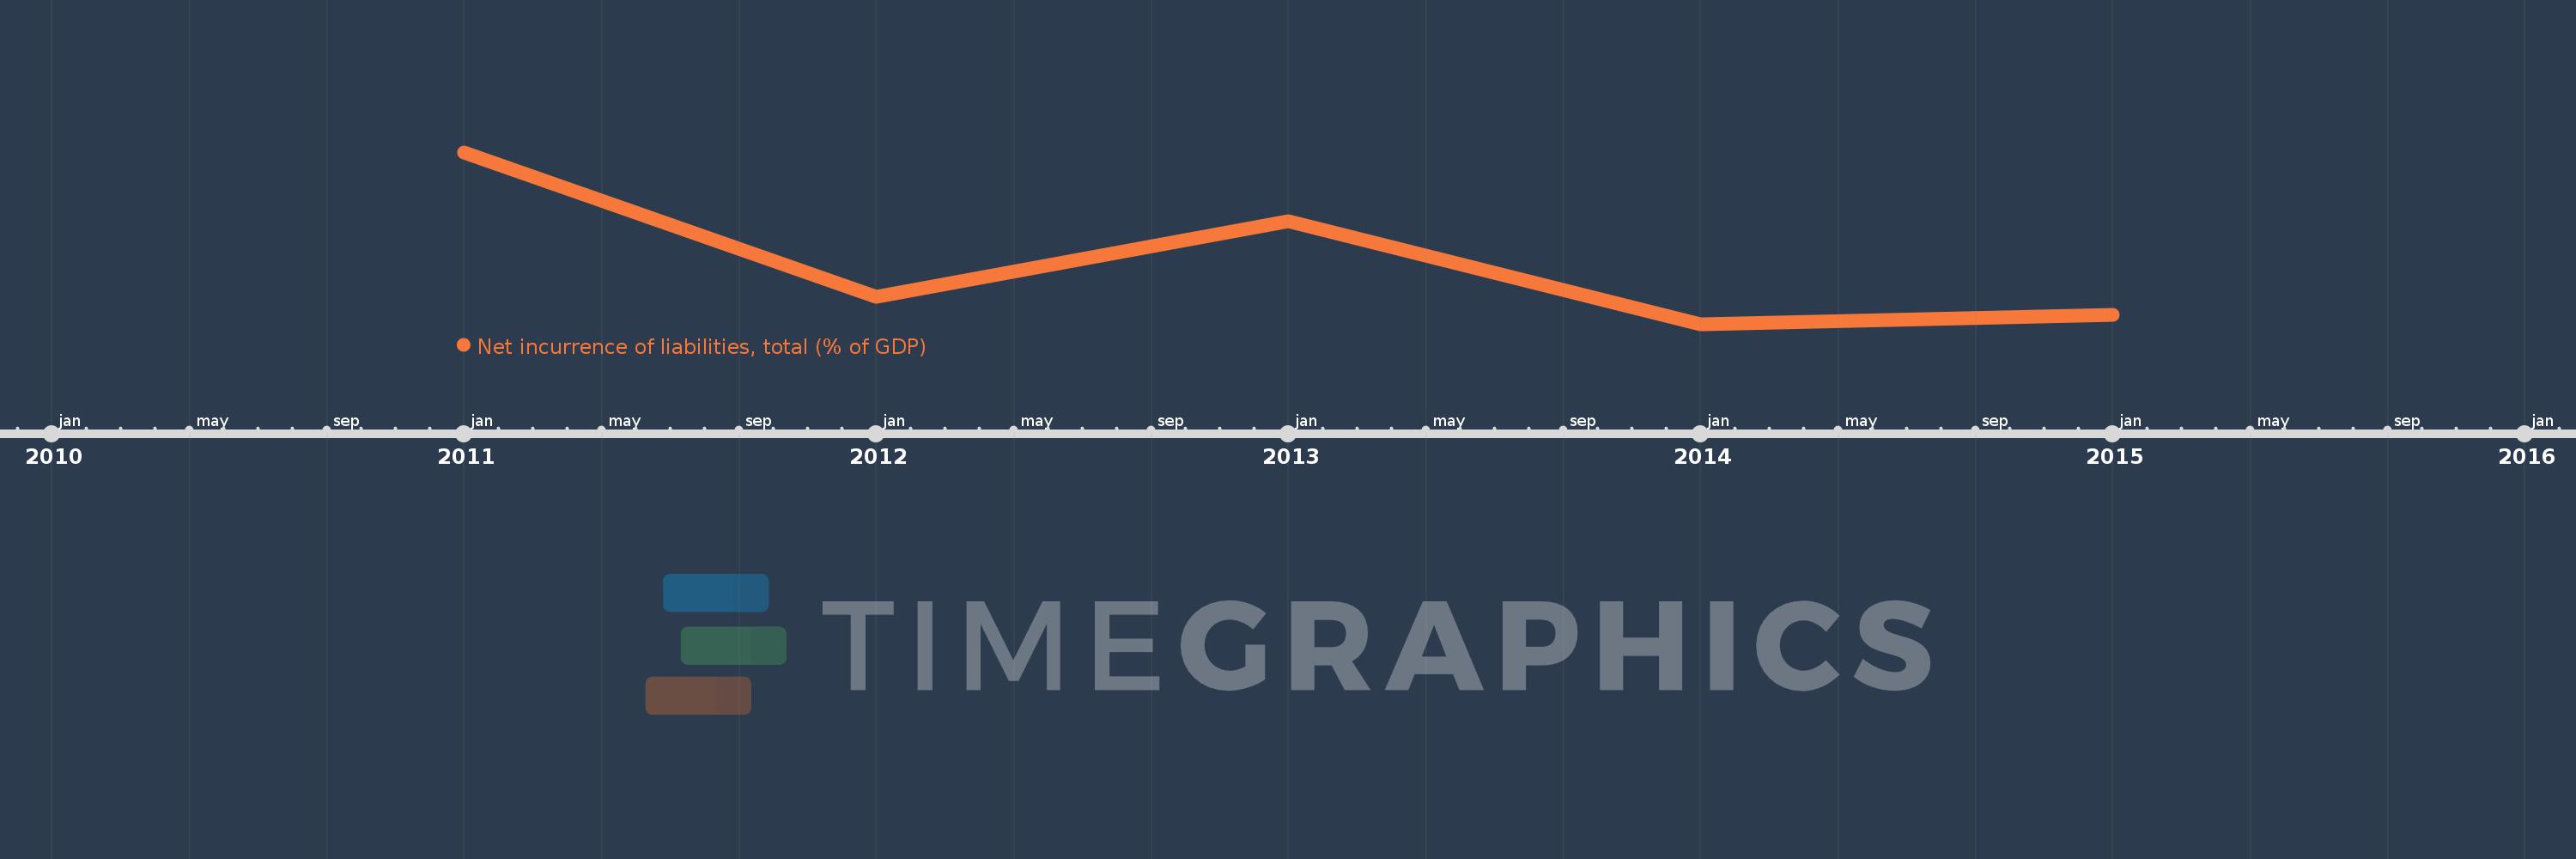
This timeline shows a graph from 2011 to 2015 of Samoa. No data until 2010. Number of actual observations by date: 5.
Source name:
World Development Indicators
Source organization:
International Monetary Fund, Government Finance Statistics Yearbook and data files.
Categories, topics:
Public Sector
Last updated:
apr 23, 2017
Indicators value changes by year
At the date of observation
Value
Absolute change
Change from the previous value
jan 1, 2011
8.425
+8.425
0.0%
jan 1, 2012
5.132
-3.293
-39.09%
jan 1, 2013
6.869
+1.738
33.86%
jan 1, 2014
4.517
-2.352
-34.24%
jan 1, 2015
4.731
+0.213
4.72%
Ranking of countries by current statistics by years