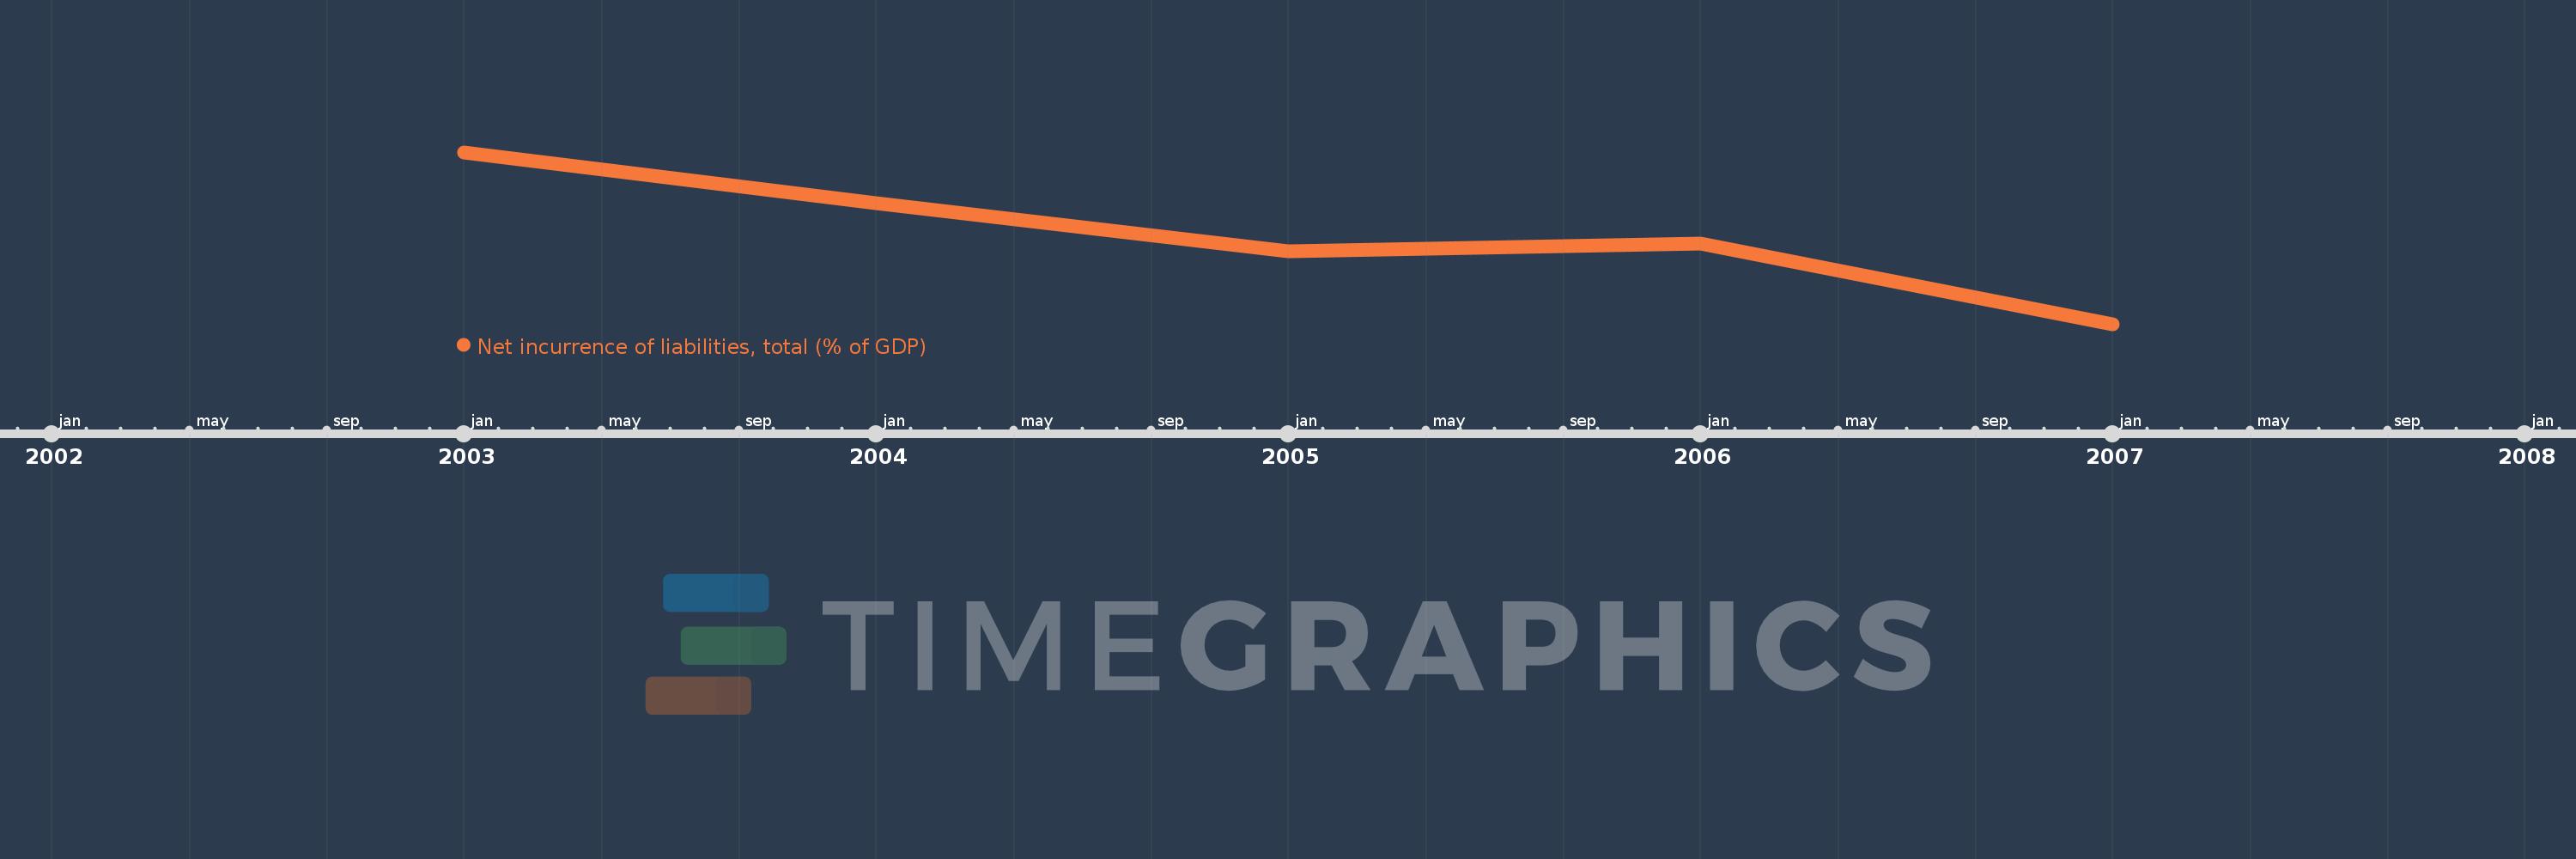
This timeline shows a graph from 2003 to 2007 of Middle East & North Africa (IDA & IBRD countries). No data until 2002. Number of actual observations by date: 5.
Source name:
World Development Indicators
Source organization:
International Monetary Fund, Government Finance Statistics Yearbook and data files.
Categories, topics:
Public Sector
Last updated:
apr 23, 2017
Indicators value changes by year
Meaning:
3.417
Minimum:
1.702
jan 1, 2007
Maximum:
5.003
jan 1, 2003
At the date of observation
Value
Absolute change
Change from the previous value
jan 1, 2003
5.003
+5.003
0.0%
jan 1, 2004
4.034
-0.969
-19.36%
jan 1, 2005
3.097
-0.938
-23.25%
jan 1, 2006
3.248
+0.151
4.88%
jan 1, 2007
1.702
-1.546
-47.59%
Ranking of countries by current statistics by years