Download This statistics in other country:
Timeline:
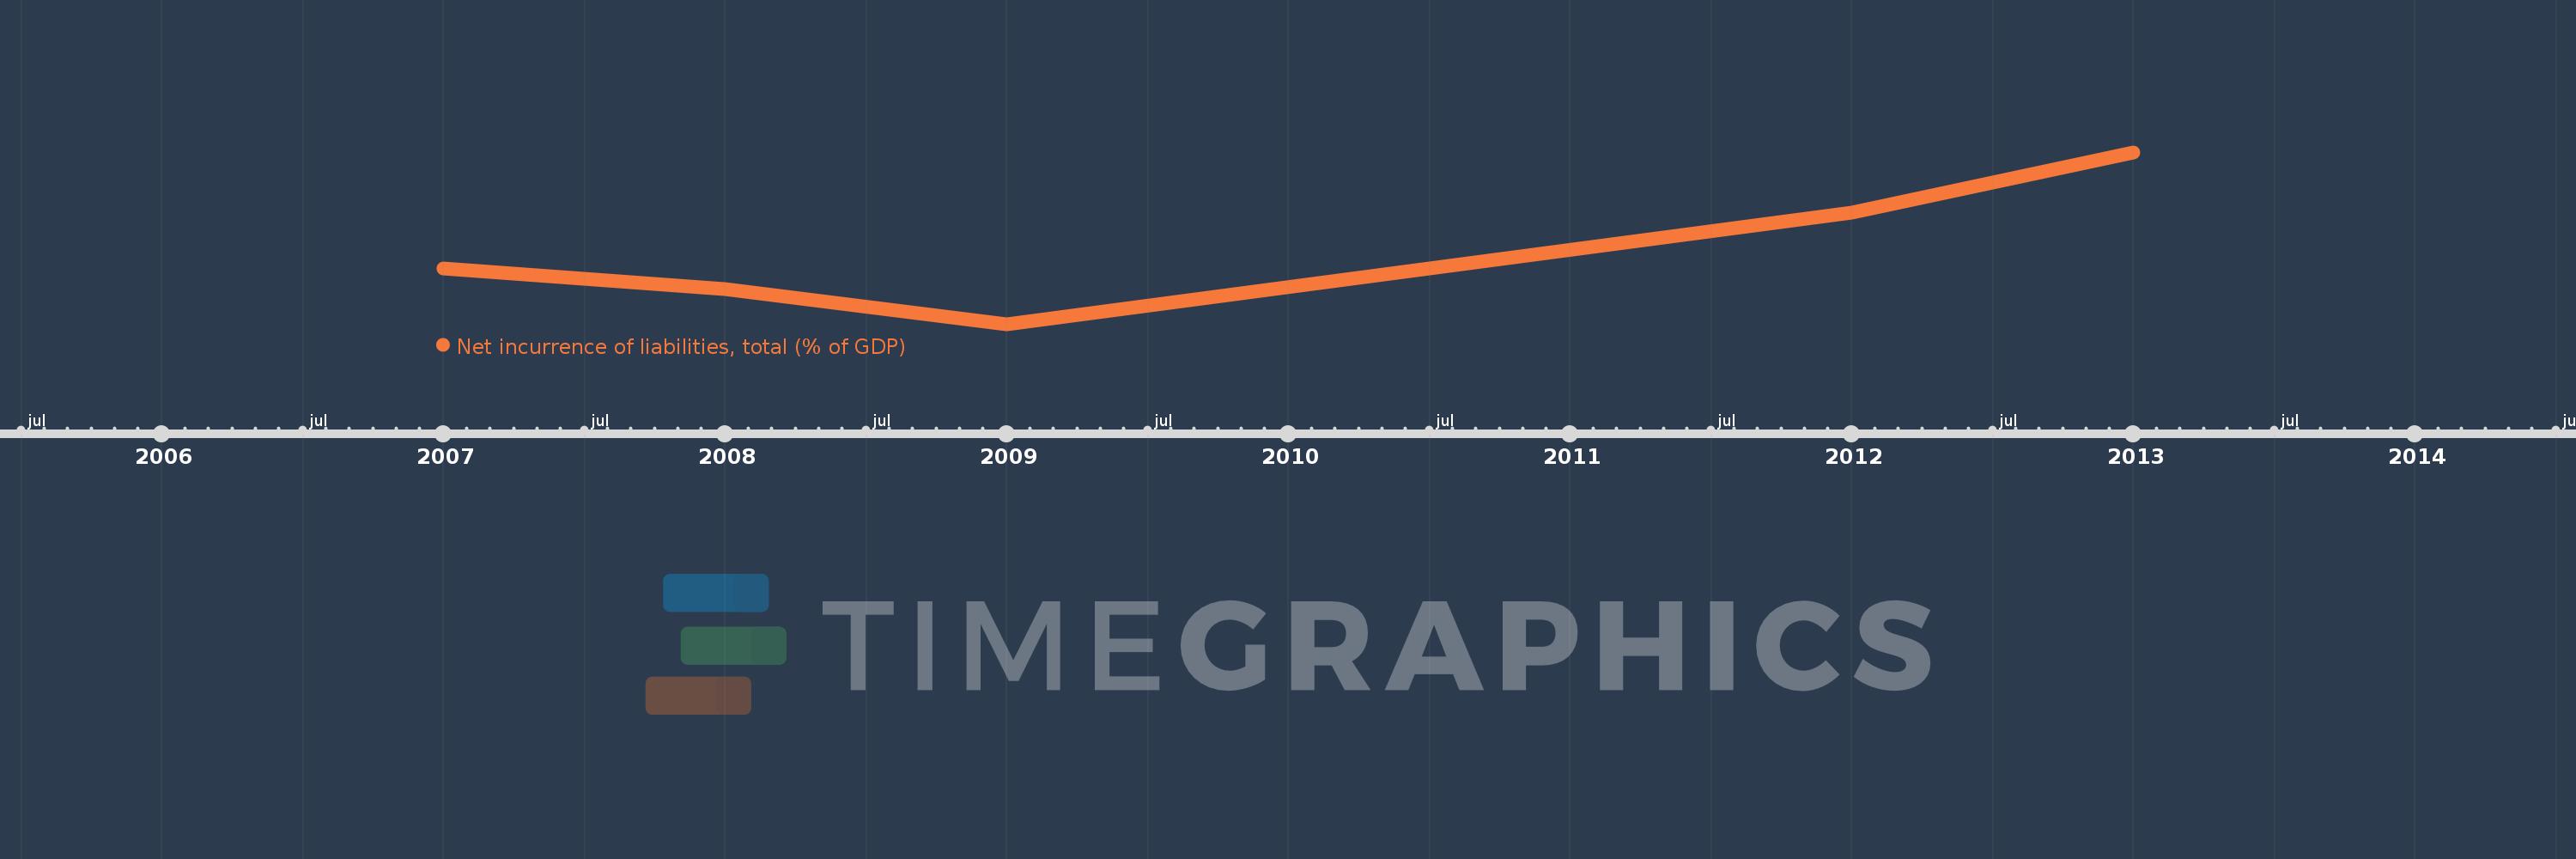
This timeline shows a graph from 2007 to 2013 of Congo, Rep.. No data until 2006. Number of actual observations by date: 5.
Source name:
World Development Indicators
Source organization:
International Monetary Fund, Government Finance Statistics Yearbook and data files.
Categories, topics:
Public Sector
Last updated:
apr 23, 2017
Indicators value changes by year
Minimum:
-14.696
jan 1, 2009
At the date of observation
Value
Absolute change
Change from the previous value
jan 1, 2007
-7.61
-7.61
0.0%
jan 1, 2008
-10.216
-2.606
34.25%
jan 1, 2009
-14.696
-4.48
43.86%
jan 1, 2012
-0.516
+14.18
-96.49%
jan 1, 2013
7.09
+7.606
-1.47K%
Ranking of countries by current statistics by years