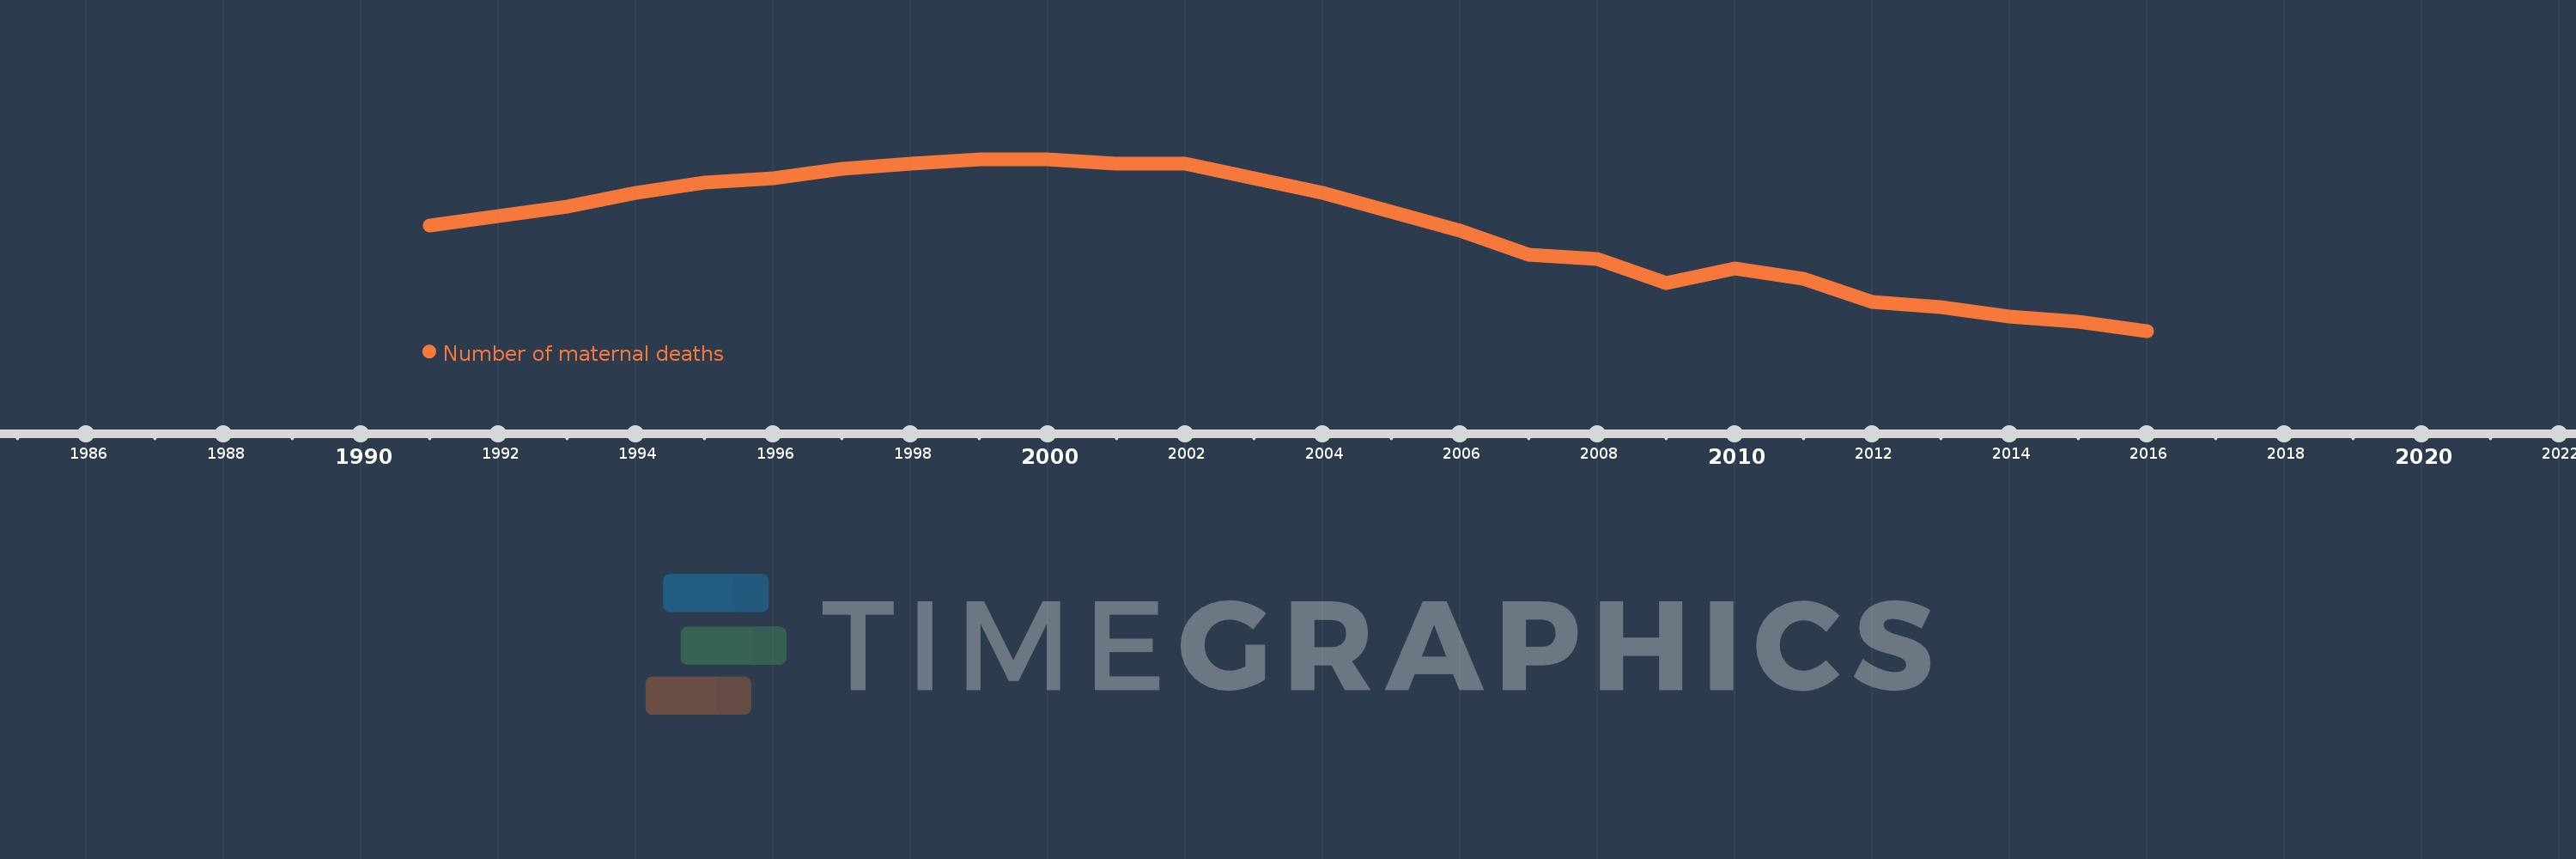
This timeline shows a graph from 1991 to 2016 of Sub-Saharan Africa . No data until 1990. Number of actual observations by date: 26.
Source name:
World Development Indicators
Source organization:
WHO, UNICEF, UNFPA, World Bank Group, and the United Nations Population Division. Trends in Maternal Mortality: 1990 to 2015. Geneva, World Health Organization, 2015
Categories, topics:
Health
Last updated:
apr 23, 2017
Indicators value changes by year
Meaning:
222.654K
Minimum:
201.0K
jan 1, 2016
Maximum:
237.0K
jan 1, 1999
At the date of observation
Value
Absolute change
Change from the previous value
jan 1, 1991
223.0K
+223.0K
0.0%
jan 1, 1992
225.0K
+2.0K
0.9%
jan 1, 1993
227.0K
+2.0K
0.89%
jan 1, 1994
230.0K
+3.0K
1.32%
jan 1, 1995
232.0K
+2.0K
0.87%
jan 1, 1996
233.0K
+1000.0
0.43%
jan 1, 1997
235.0K
+2.0K
0.86%
jan 1, 1998
236.0K
+1000.0
0.43%
jan 1, 1999
237.0K
+1000.0
0.42%
jan 1, 2000
237.0K
0.0
0.0%
jan 1, 2001
236.0K
-1000.0
-0.42%
jan 1, 2002
236.0K
0.0
0.0%
jan 1, 2003
233.0K
-3.0K
-1.27%
jan 1, 2004
230.0K
-3.0K
-1.29%
jan 1, 2005
226.0K
-4.0K
-1.74%
jan 1, 2006
222.0K
-4.0K
-1.77%
jan 1, 2007
217.0K
-5.0K
-2.25%
jan 1, 2008
216.0K
-1000.0
-0.46%
jan 1, 2009
211.0K
-5.0K
-2.31%
jan 1, 2010
214.0K
+3.0K
1.42%
jan 1, 2011
212.0K
-2.0K
-0.93%
jan 1, 2012
207.0K
-5.0K
-2.36%
jan 1, 2013
206.0K
-1000.0
-0.48%
jan 1, 2014
204.0K
-2.0K
-0.97%
jan 1, 2015
203.0K
-1000.0
-0.49%
jan 1, 2016
201.0K
-2.0K
-0.99%
Ranking of countries by current statistics by years