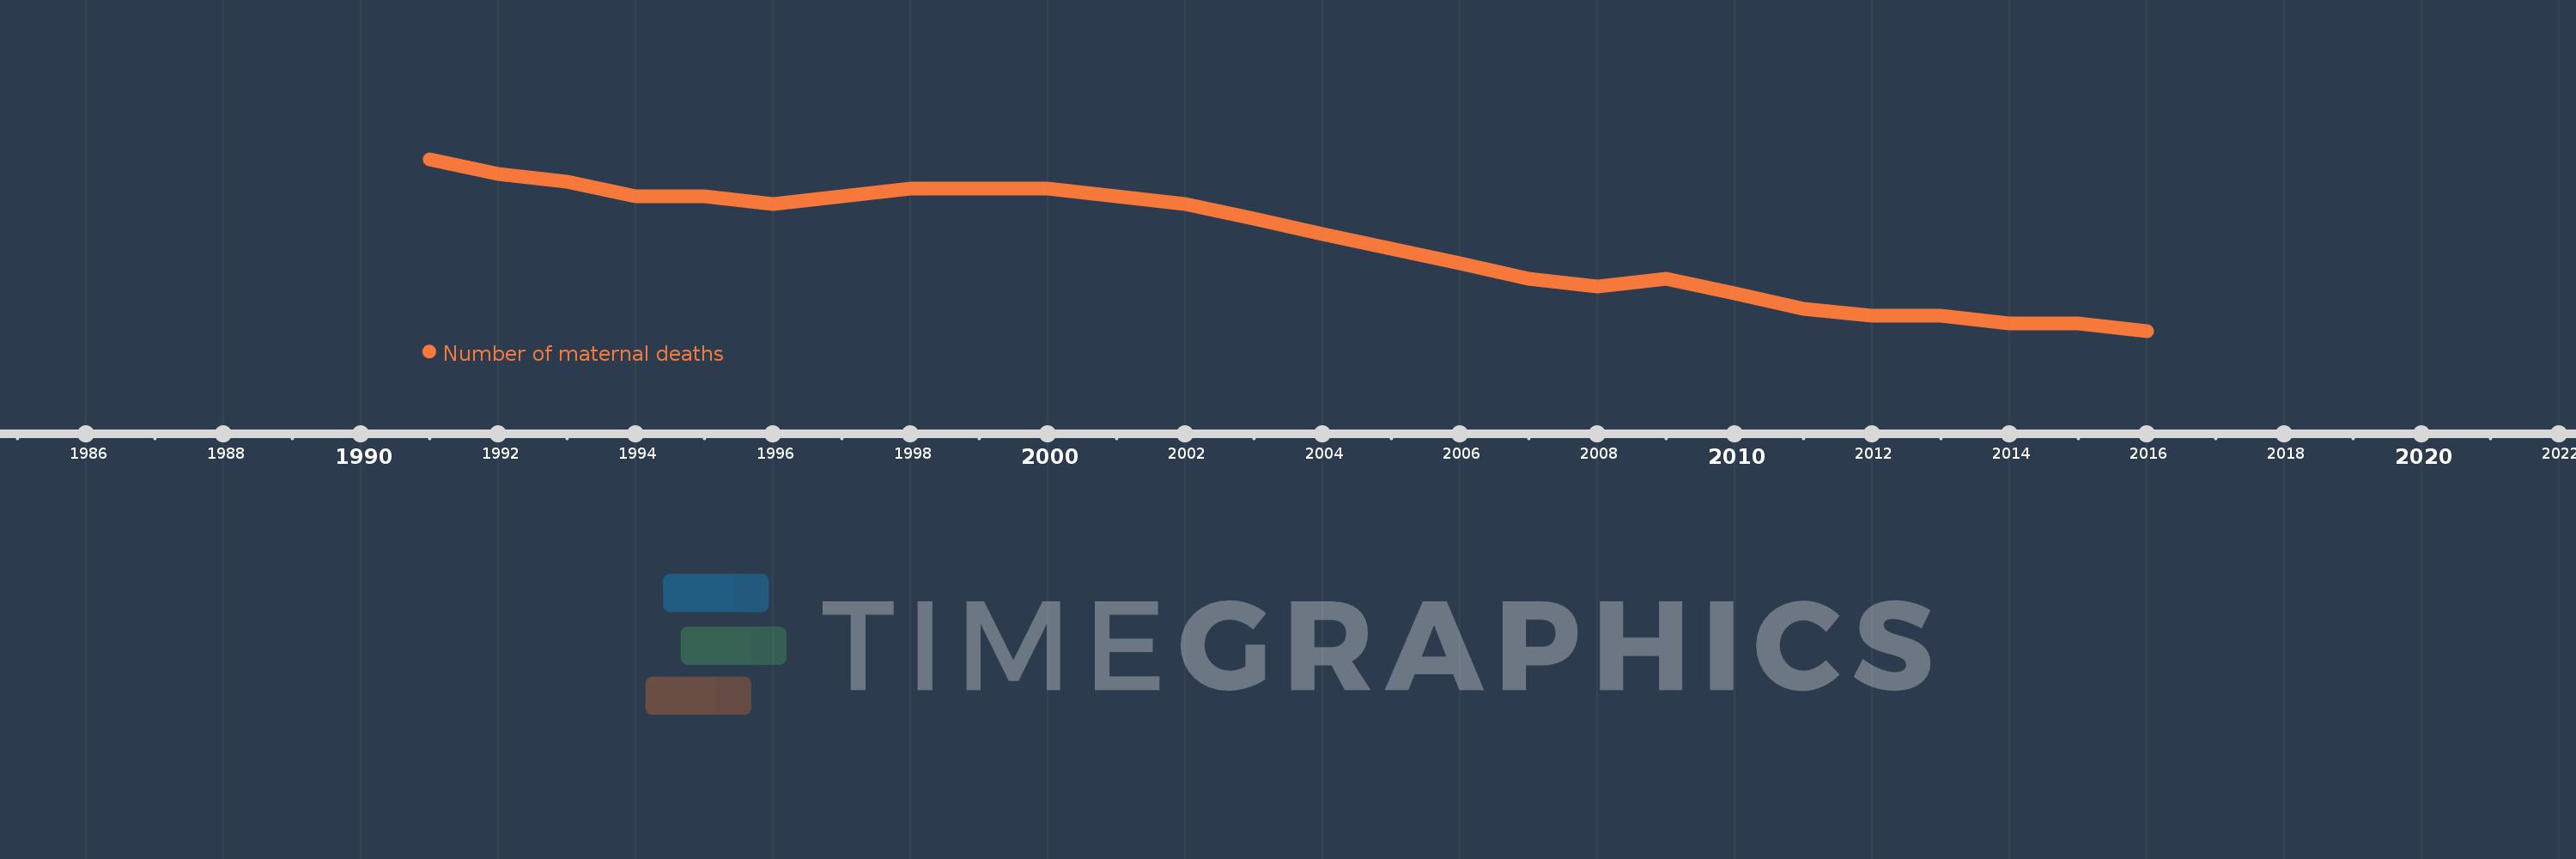
This timeline shows a graph from 1991 to 2016 of Papua New Guinea. No data until 1990. Number of actual observations by date: 26.
Source name:
World Development Indicators
Source organization:
WHO, UNICEF, UNFPA, World Bank Group, and the United Nations Population Division. Trends in Maternal Mortality: 1990 to 2015. Geneva, World Health Organization, 2015
Categories, topics:
Health
Last updated:
apr 23, 2017
Indicators value changes by year
Meaning:
578.846
Minimum:
460.0
jan 1, 2016
Maximum:
690.0
jan 1, 1991
At the date of observation
Value
Absolute change
Change from the previous value
jan 1, 1991
690.0
+690.0
0.0%
jan 1, 1992
670.0
-20.0
-2.9%
jan 1, 1993
660.0
-10.0
-1.49%
jan 1, 1994
640.0
-20.0
-3.03%
jan 1, 1995
640.0
0.0
0.0%
jan 1, 1996
630.0
-10.0
-1.56%
jan 1, 1997
640.0
+10.0
1.59%
jan 1, 1998
650.0
+10.0
1.56%
jan 1, 1999
650.0
0.0
0.0%
jan 1, 2000
650.0
0.0
0.0%
jan 1, 2001
640.0
-10.0
-1.54%
jan 1, 2002
630.0
-10.0
-1.56%
jan 1, 2003
610.0
-20.0
-3.17%
jan 1, 2004
590.0
-20.0
-3.28%
jan 1, 2005
570.0
-20.0
-3.39%
jan 1, 2006
550.0
-20.0
-3.51%
jan 1, 2007
530.0
-20.0
-3.64%
jan 1, 2008
520.0
-10.0
-1.89%
jan 1, 2009
530.0
+10.0
1.92%
jan 1, 2010
510.0
-20.0
-3.77%
jan 1, 2011
490.0
-20.0
-3.92%
jan 1, 2012
480.0
-10.0
-2.04%
jan 1, 2013
480.0
0.0
0.0%
jan 1, 2014
470.0
-10.0
-2.08%
jan 1, 2015
470.0
0.0
0.0%
jan 1, 2016
460.0
-10.0
-2.13%
Ranking of countries by current statistics by years