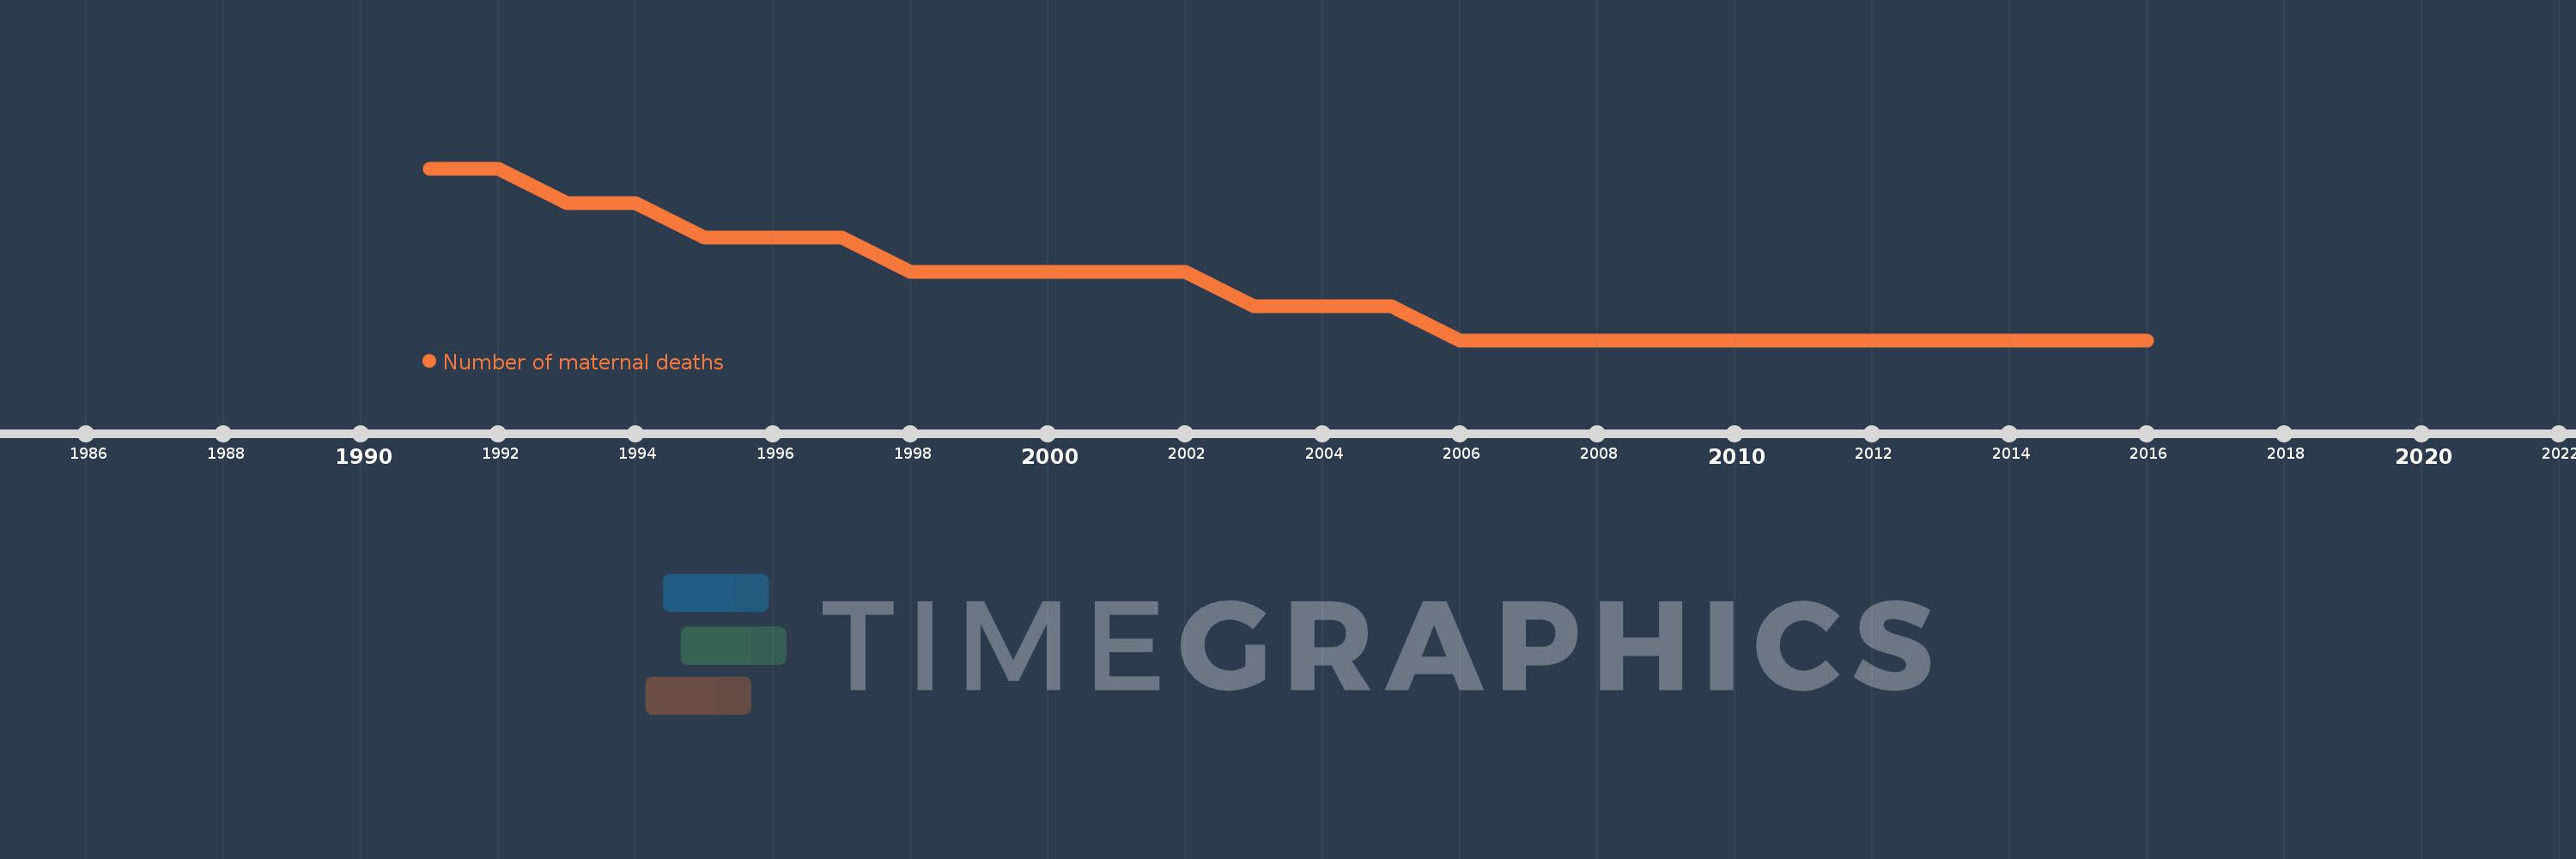
This timeline shows a graph from 1991 to 2016 of Sao Tome and Principe. No data until 1990. Number of actual observations by date: 26.
Source name:
World Development Indicators
Source organization:
WHO, UNICEF, UNFPA, World Bank Group, and the United Nations Population Division. Trends in Maternal Mortality: 1990 to 2015. Geneva, World Health Organization, 2015
Categories, topics:
Health
Last updated:
apr 23, 2017
Indicators value changes by year
Meaning:
11.538
Minimum:
10.0
jan 1, 2006
Maximum:
15.0
jan 1, 1991
At the date of observation
Value
Absolute change
Change from the previous value
jan 1, 1991
15.0
+15.0
0.0%
jan 1, 1992
15.0
0.0
0.0%
jan 1, 1993
14.0
-1.0
-6.67%
jan 1, 1994
14.0
0.0
0.0%
jan 1, 1995
13.0
-1.0
-7.14%
jan 1, 1996
13.0
0.0
0.0%
jan 1, 1997
13.0
0.0
0.0%
jan 1, 1998
12.0
-1.0
-7.69%
jan 1, 1999
12.0
0.0
0.0%
jan 1, 2000
12.0
0.0
0.0%
jan 1, 2001
12.0
0.0
0.0%
jan 1, 2002
12.0
0.0
0.0%
jan 1, 2003
11.0
-1.0
-8.33%
jan 1, 2004
11.0
0.0
0.0%
jan 1, 2005
11.0
0.0
0.0%
jan 1, 2006
10.0
-1.0
-9.09%
jan 1, 2007
10.0
0.0
0.0%
jan 1, 2008
10.0
0.0
0.0%
jan 1, 2009
10.0
0.0
0.0%
jan 1, 2010
10.0
0.0
0.0%
jan 1, 2011
10.0
0.0
0.0%
jan 1, 2012
10.0
0.0
0.0%
jan 1, 2013
10.0
0.0
0.0%
jan 1, 2014
10.0
0.0
0.0%
jan 1, 2015
10.0
0.0
0.0%
jan 1, 2016
10.0
0.0
0.0%
Ranking of countries by current statistics by years