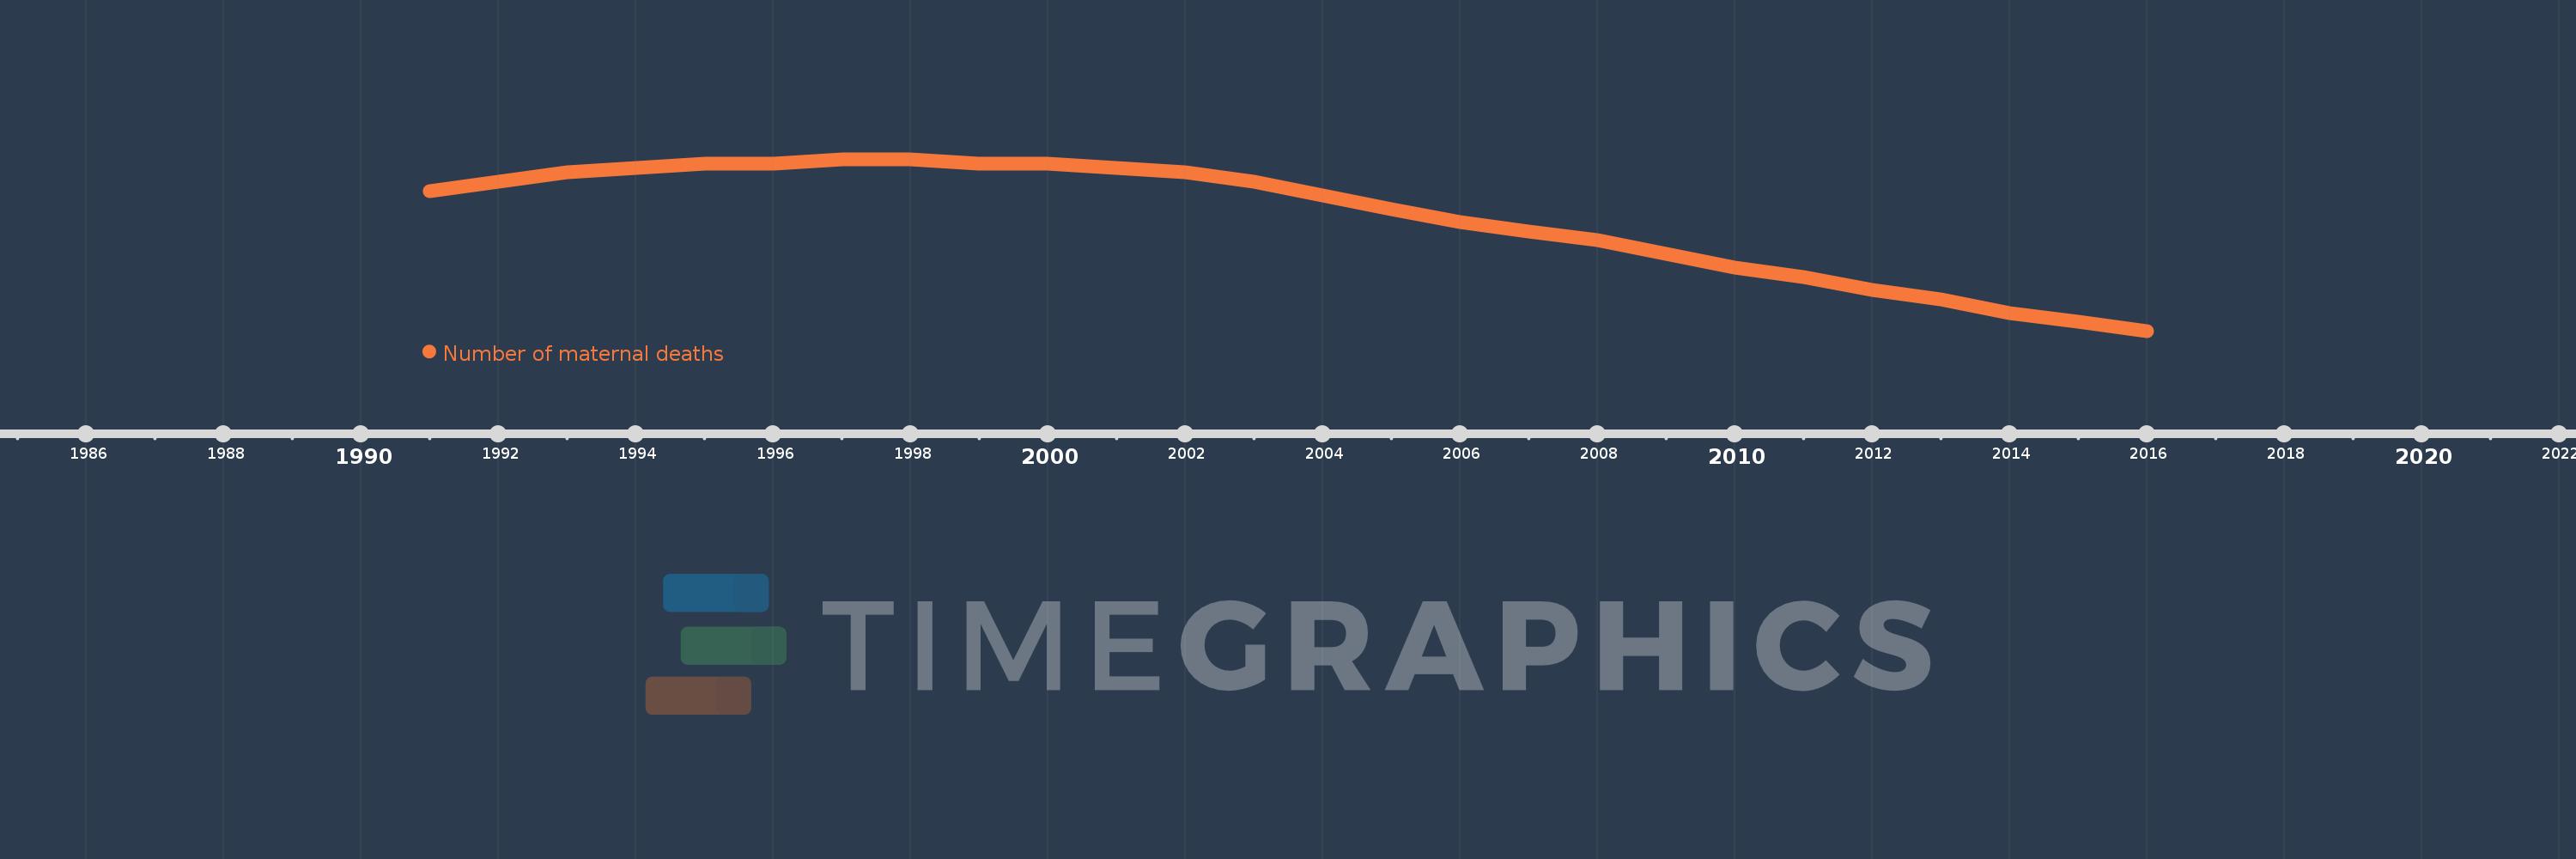
This timeline shows a graph from 1991 to 2016 of Low income. No data until 1990. Number of actual observations by date: 26.
Source name:
World Development Indicators
Source organization:
WHO, UNICEF, UNFPA, World Bank Group, and the United Nations Population Division. Trends in Maternal Mortality: 1990 to 2015. Geneva, World Health Organization, 2015
Categories, topics:
Health
Last updated:
apr 23, 2017
Indicators value changes by year
Meaning:
139.038K
Minimum:
114.0K
jan 1, 2016
Maximum:
152.0K
jan 1, 1997
At the date of observation
Value
Absolute change
Change from the previous value
jan 1, 1991
145.0K
+145.0K
0.0%
jan 1, 1992
147.0K
+2.0K
1.38%
jan 1, 1993
149.0K
+2.0K
1.36%
jan 1, 1994
150.0K
+1000.0
0.67%
jan 1, 1995
151.0K
+1000.0
0.67%
jan 1, 1996
151.0K
0.0
0.0%
jan 1, 1997
152.0K
+1000.0
0.66%
jan 1, 1998
152.0K
0.0
0.0%
jan 1, 1999
151.0K
-1000.0
-0.66%
jan 1, 2000
151.0K
0.0
0.0%
jan 1, 2001
150.0K
-1000.0
-0.66%
jan 1, 2002
149.0K
-1000.0
-0.67%
jan 1, 2003
147.0K
-2.0K
-1.34%
jan 1, 2004
144.0K
-3.0K
-2.04%
jan 1, 2005
141.0K
-3.0K
-2.08%
jan 1, 2006
138.0K
-3.0K
-2.13%
jan 1, 2007
136.0K
-2.0K
-1.45%
jan 1, 2008
134.0K
-2.0K
-1.47%
jan 1, 2009
131.0K
-3.0K
-2.24%
jan 1, 2010
128.0K
-3.0K
-2.29%
jan 1, 2011
126.0K
-2.0K
-1.56%
jan 1, 2012
123.0K
-3.0K
-2.38%
jan 1, 2013
121.0K
-2.0K
-1.63%
jan 1, 2014
118.0K
-3.0K
-2.48%
jan 1, 2015
116.0K
-2.0K
-1.69%
jan 1, 2016
114.0K
-2.0K
-1.72%
Ranking of countries by current statistics by years