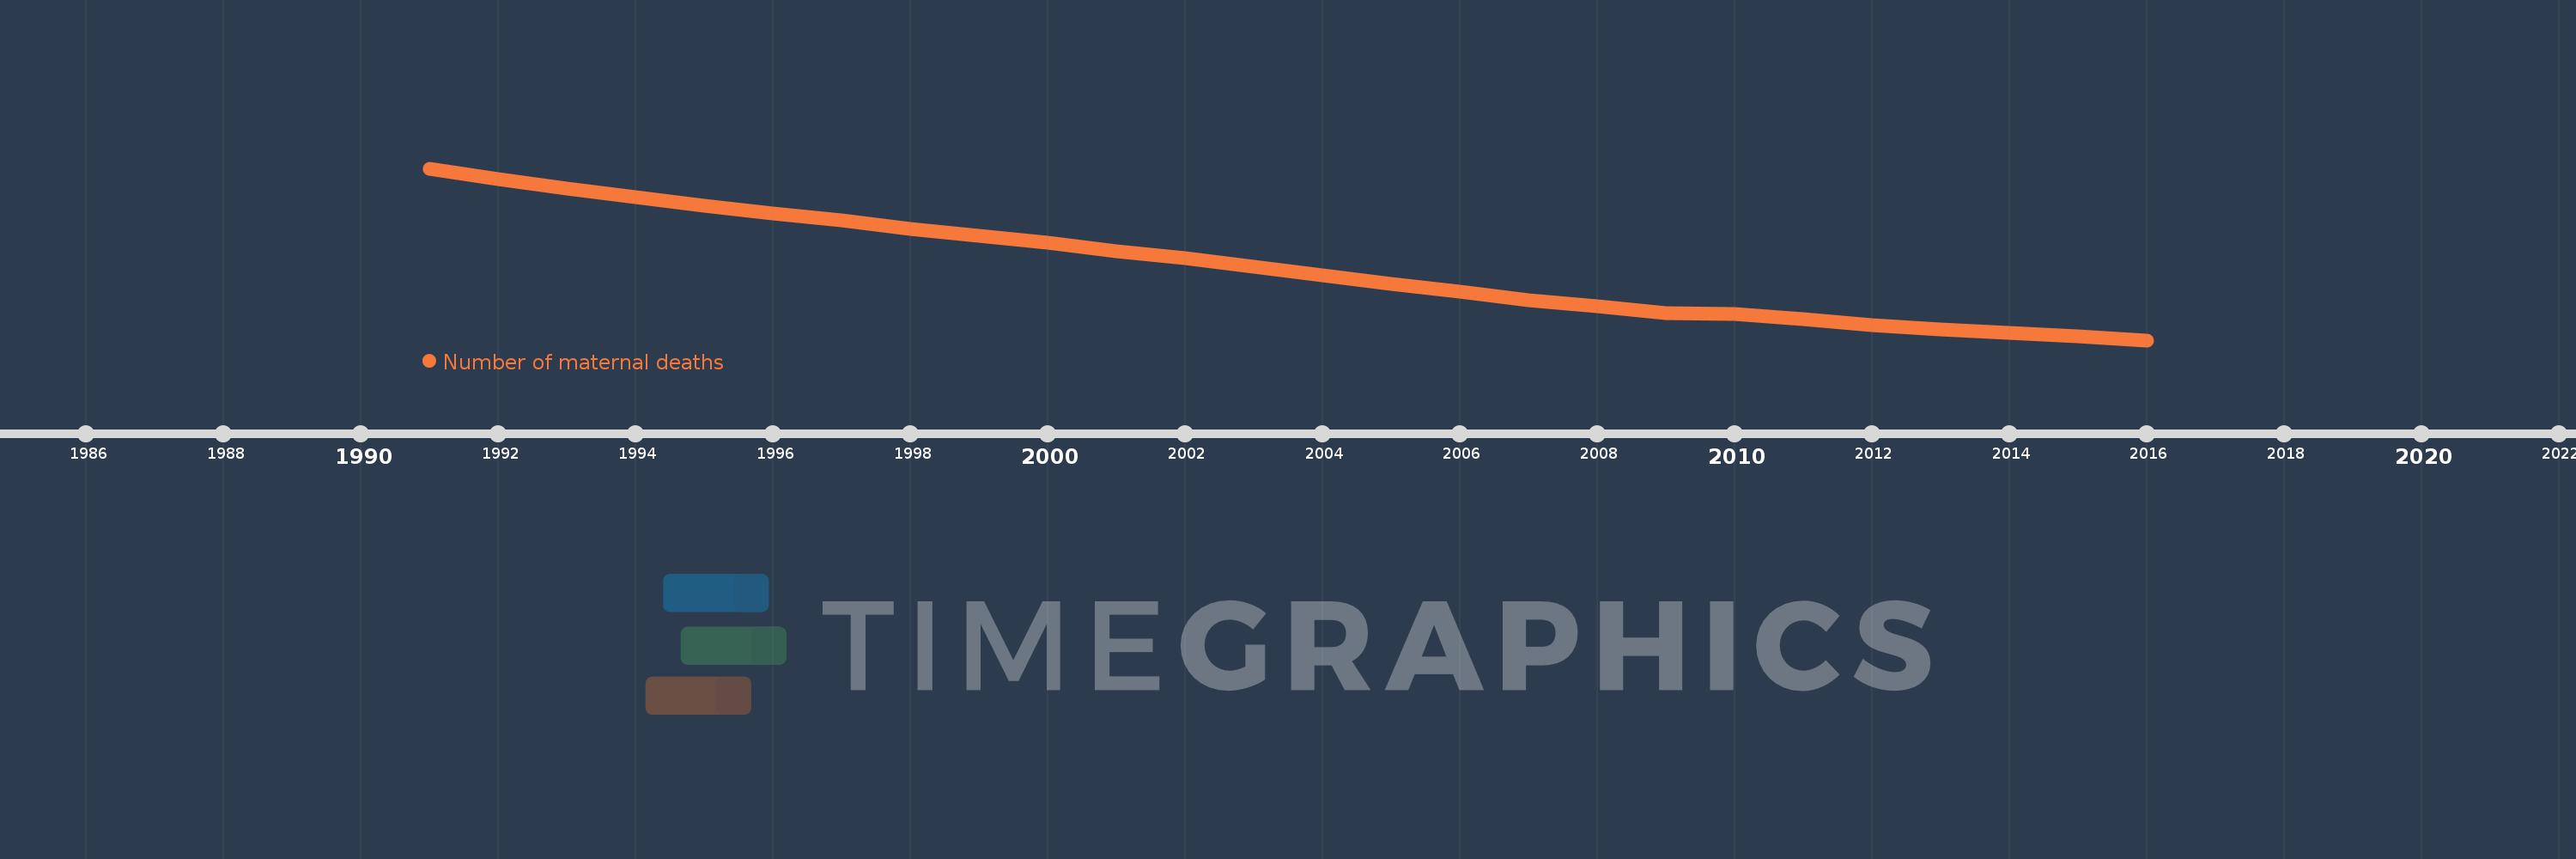
This timeline shows a graph from 1991 to 2016 of Middle income. No data until 1990. Number of actual observations by date: 26.
Source name:
World Development Indicators
Source organization:
WHO, UNICEF, UNFPA, World Bank Group, and the United Nations Population Division. Trends in Maternal Mortality: 1990 to 2015. Geneva, World Health Organization, 2015
Categories, topics:
Health
Last updated:
apr 23, 2017
Indicators value changes by year
Meaning:
272.692K
Minimum:
188.0K
jan 1, 2016
Maximum:
385.0K
jan 1, 1991
At the date of observation
Value
Absolute change
Change from the previous value
jan 1, 1991
385.0K
+385.0K
0.0%
jan 1, 1992
373.0K
-12.0K
-3.12%
jan 1, 1993
362.0K
-11.0K
-2.95%
jan 1, 1994
352.0K
-10.0K
-2.76%
jan 1, 1995
342.0K
-10.0K
-2.84%
jan 1, 1996
333.0K
-9.0K
-2.63%
jan 1, 1997
325.0K
-8.0K
-2.4%
jan 1, 1998
316.0K
-9.0K
-2.77%
jan 1, 1999
308.0K
-8.0K
-2.53%
jan 1, 2000
300.0K
-8.0K
-2.6%
jan 1, 2001
290.0K
-10.0K
-3.33%
jan 1, 2002
282.0K
-8.0K
-2.76%
jan 1, 2003
272.0K
-10.0K
-3.55%
jan 1, 2004
262.0K
-10.0K
-3.68%
jan 1, 2005
253.0K
-9.0K
-3.44%
jan 1, 2006
244.0K
-9.0K
-3.56%
jan 1, 2007
234.0K
-10.0K
-4.1%
jan 1, 2008
227.0K
-7.0K
-2.99%
jan 1, 2009
219.0K
-8.0K
-3.52%
jan 1, 2010
218.0K
-1000.0
-0.46%
jan 1, 2011
212.0K
-6.0K
-2.75%
jan 1, 2012
205.0K
-7.0K
-3.3%
jan 1, 2013
200.0K
-5.0K
-2.44%
jan 1, 2014
196.0K
-4.0K
-2.0%
jan 1, 2015
192.0K
-4.0K
-2.04%
jan 1, 2016
188.0K
-4.0K
-2.08%
Ranking of countries by current statistics by years