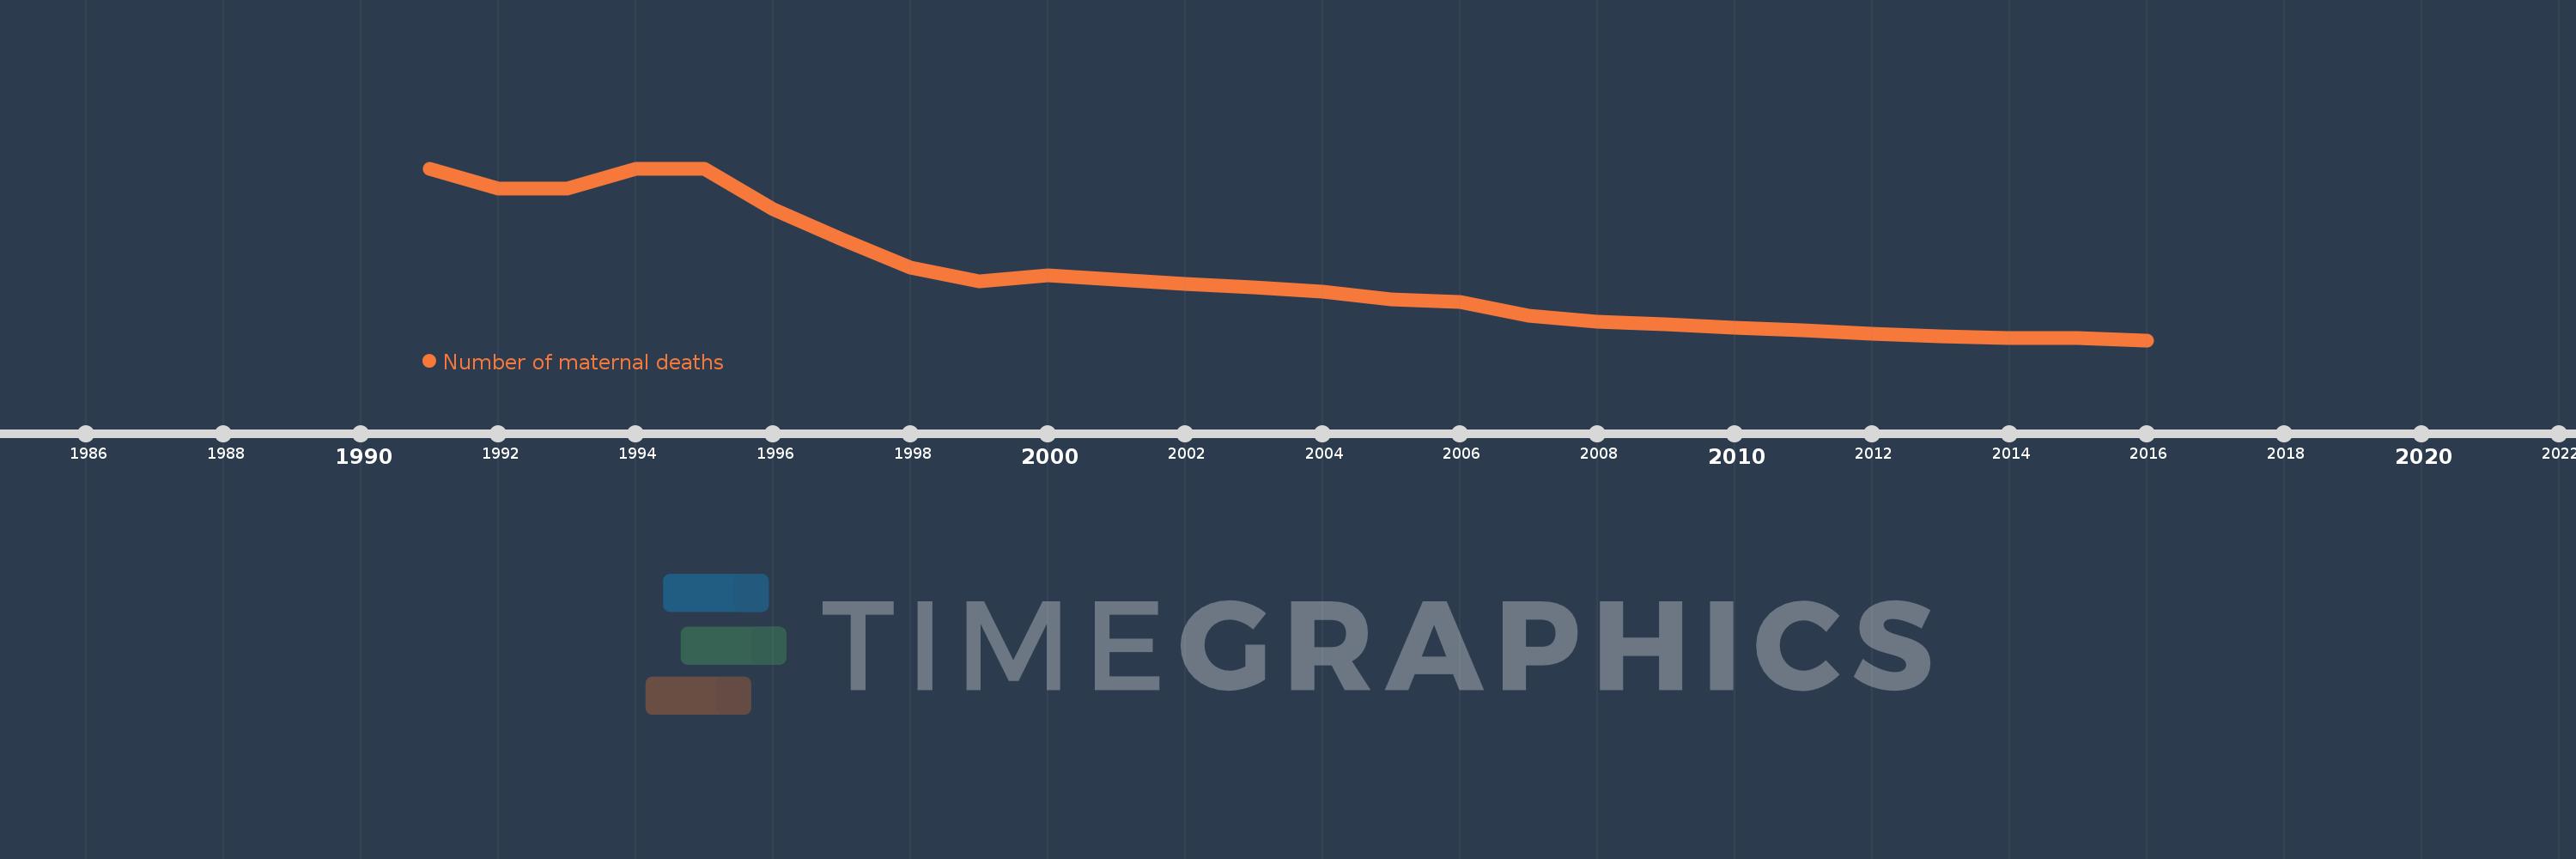
This timeline shows a graph from 1991 to 2016 of Russian Federation. No data until 1990. Number of actual observations by date: 26.
Source name:
World Development Indicators
Source organization:
WHO, UNICEF, UNFPA, World Bank Group, and the United Nations Population Division. Trends in Maternal Mortality: 1990 to 2015. Geneva, World Health Organization, 2015
Categories, topics:
Health
Last updated:
apr 23, 2017
Indicators value changes by year
Meaning:
761.923
Minimum:
450.0
jan 1, 2016
Maximum:
1.3K
jan 1, 1991
At the date of observation
Value
Absolute change
Change from the previous value
jan 1, 1991
1.3K
+1.3K
0.0%
jan 1, 1992
1.2K
-100.0
-7.69%
jan 1, 1993
1.2K
0.0
0.0%
jan 1, 1994
1.3K
+100.0
8.33%
jan 1, 1995
1.3K
0.0
0.0%
jan 1, 1996
1.1K
-200.0
-15.38%
jan 1, 1997
950.0
-150.0
-13.64%
jan 1, 1998
810.0
-140.0
-14.74%
jan 1, 1999
740.0
-70.0
-8.64%
jan 1, 2000
770.0
+30.0
4.05%
jan 1, 2001
750.0
-20.0
-2.6%
jan 1, 2002
730.0
-20.0
-2.67%
jan 1, 2003
710.0
-20.0
-2.74%
jan 1, 2004
690.0
-20.0
-2.82%
jan 1, 2005
650.0
-40.0
-5.8%
jan 1, 2006
640.0
-10.0
-1.54%
jan 1, 2007
570.0
-70.0
-10.94%
jan 1, 2008
540.0
-30.0
-5.26%
jan 1, 2009
530.0
-10.0
-1.85%
jan 1, 2010
510.0
-20.0
-3.77%
jan 1, 2011
500.0
-10.0
-1.96%
jan 1, 2012
480.0
-20.0
-4.0%
jan 1, 2013
470.0
-10.0
-2.08%
jan 1, 2014
460.0
-10.0
-2.13%
jan 1, 2015
460.0
0.0
0.0%
jan 1, 2016
450.0
-10.0
-2.17%
Ranking of countries by current statistics by years