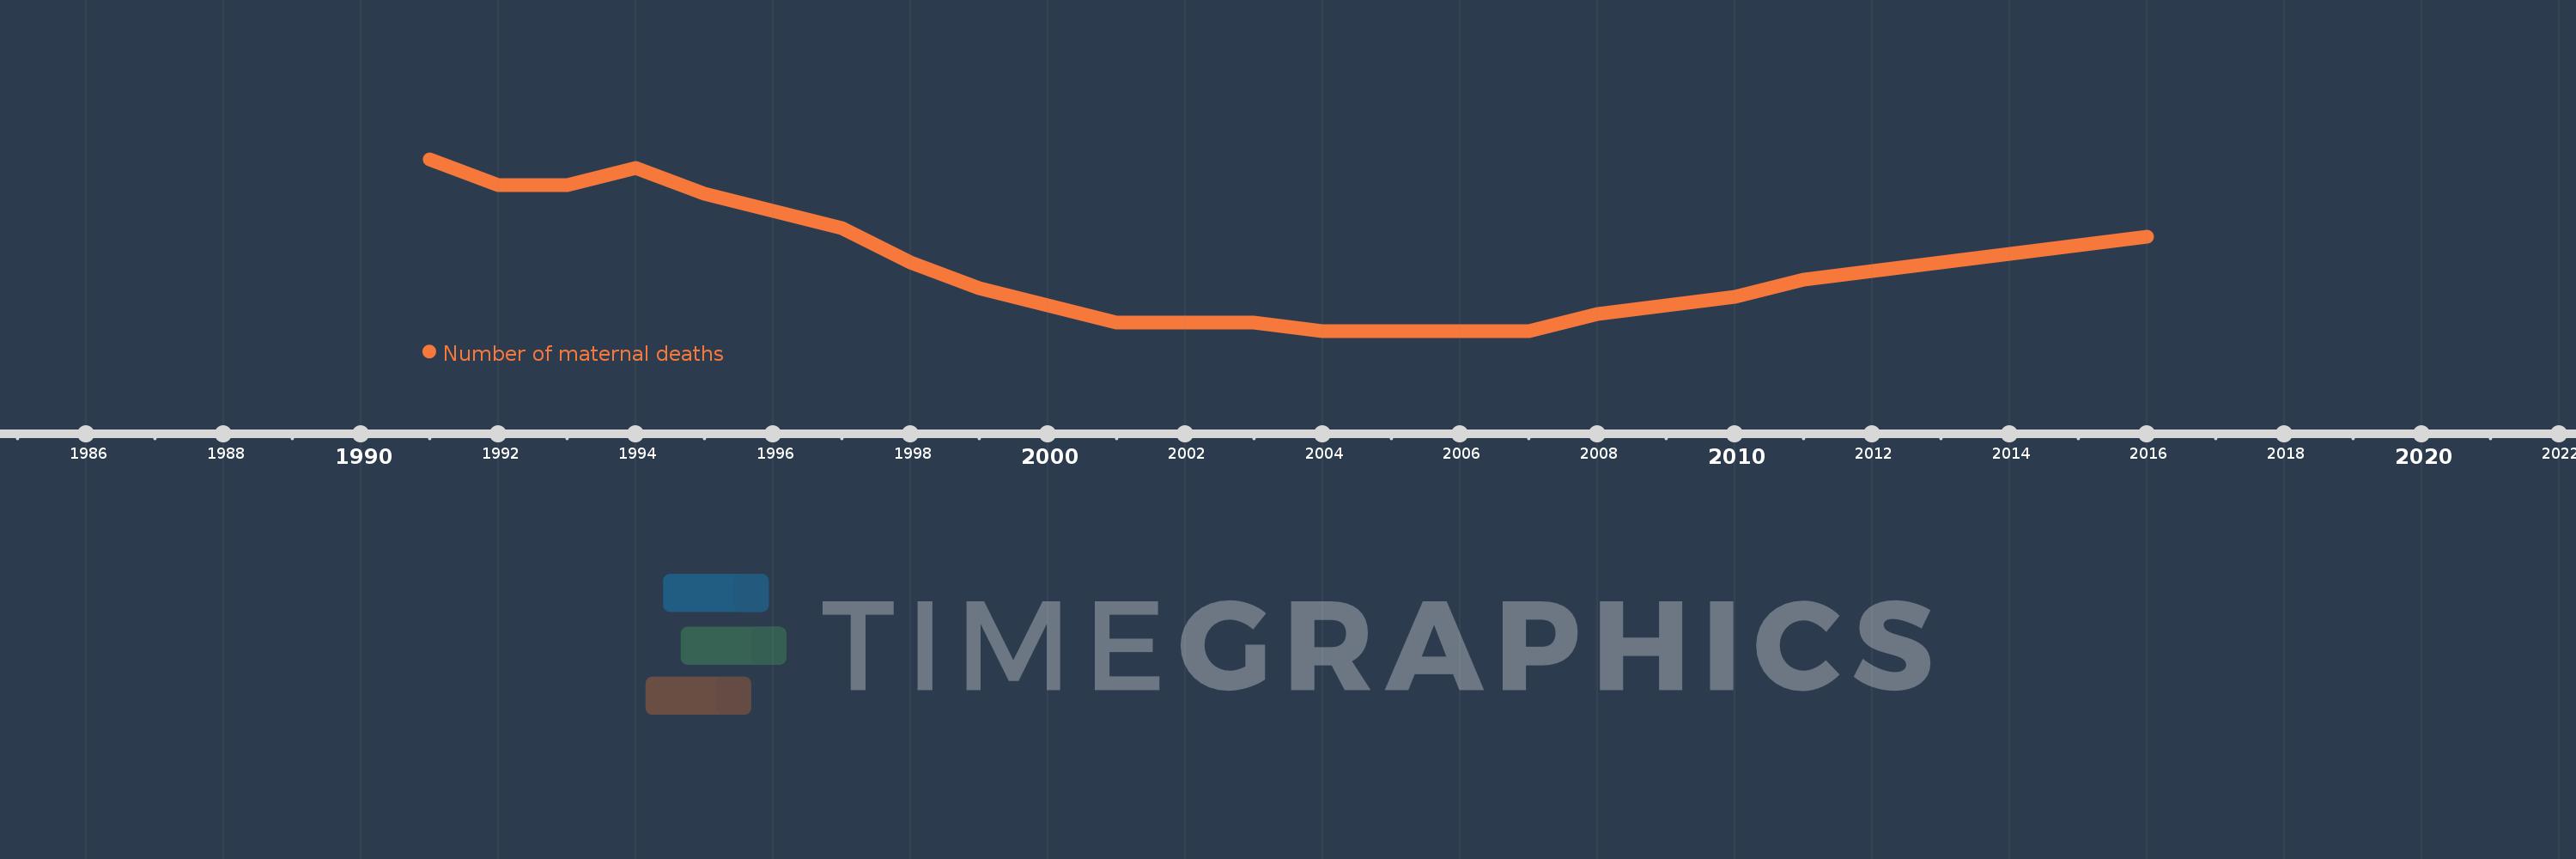
This timeline shows a graph from 1991 to 2016 of Iraq. No data until 1990. Number of actual observations by date: 26.
Source name:
World Development Indicators
Source organization:
WHO, UNICEF, UNFPA, World Bank Group, and the United Nations Population Division. Trends in Maternal Mortality: 1990 to 2015. Geneva, World Health Organization, 2015
Categories, topics:
Health
Last updated:
apr 23, 2017
Indicators value changes by year
Meaning:
584.615
Minimum:
510.0
jan 1, 2004
Maximum:
710.0
jan 1, 1991
At the date of observation
Value
Absolute change
Change from the previous value
jan 1, 1991
710.0
+710.0
0.0%
jan 1, 1992
680.0
-30.0
-4.23%
jan 1, 1993
680.0
0.0
0.0%
jan 1, 1994
700.0
+20.0
2.94%
jan 1, 1995
670.0
-30.0
-4.29%
jan 1, 1996
650.0
-20.0
-2.99%
jan 1, 1997
630.0
-20.0
-3.08%
jan 1, 1998
590.0
-40.0
-6.35%
jan 1, 1999
560.0
-30.0
-5.08%
jan 1, 2000
540.0
-20.0
-3.57%
jan 1, 2001
520.0
-20.0
-3.7%
jan 1, 2002
520.0
0.0
0.0%
jan 1, 2003
520.0
0.0
0.0%
jan 1, 2004
510.0
-10.0
-1.92%
jan 1, 2005
510.0
0.0
0.0%
jan 1, 2006
510.0
0.0
0.0%
jan 1, 2007
510.0
0.0
0.0%
jan 1, 2008
530.0
+20.0
3.92%
jan 1, 2009
540.0
+10.0
1.89%
jan 1, 2010
550.0
+10.0
1.85%
jan 1, 2011
570.0
+20.0
3.64%
jan 1, 2012
580.0
+10.0
1.75%
jan 1, 2013
590.0
+10.0
1.72%
jan 1, 2014
600.0
+10.0
1.69%
jan 1, 2015
610.0
+10.0
1.67%
jan 1, 2016
620.0
+10.0
1.64%
Ranking of countries by current statistics by years