Download This statistics in other country:
Timeline:
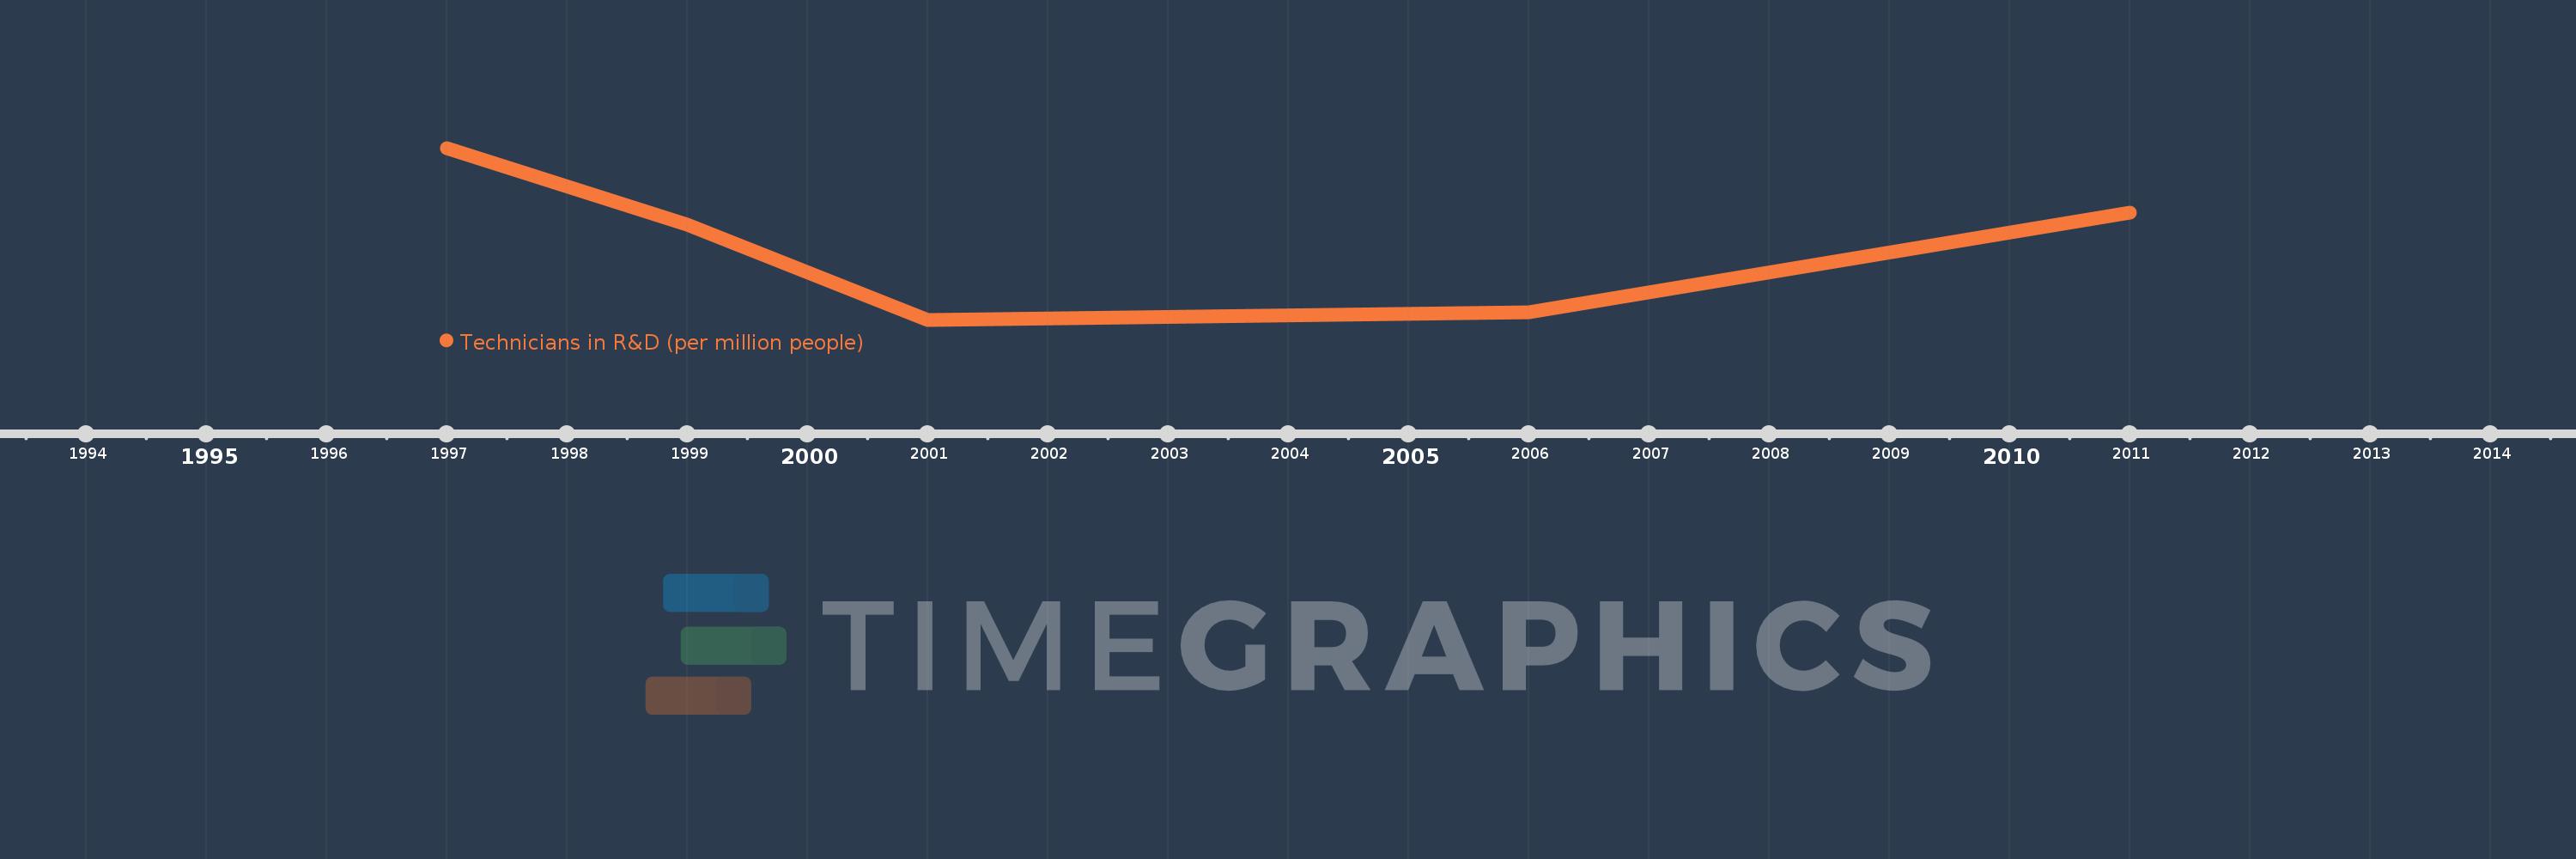
This timeline shows a graph from 1997 to 2011 of South Asia (IDA & IBRD). No data until 1996. Number of actual observations by date: 5.
Source name:
World Development Indicators
Source organization:
United Nations Educational, Scientific, and Cultural Organization (UNESCO) Institute for Statistics.
Categories, topics:
Science & Technology
Last updated:
apr 23, 2017
Indicators value changes by year
Minimum:
85.474
jan 1, 2001
Maximum:
109.917
jan 1, 1997
At the date of observation
Value
Absolute change
Change from the previous value
jan 1, 1997
109.917
+109.917
0.0%
jan 1, 1999
99.032
-10.886
-9.9%
jan 1, 2001
85.474
-13.558
-13.69%
jan 1, 2006
86.523
+1.049
1.23%
jan 1, 2011
100.736
+14.214
16.43%
Ranking of countries by current statistics by years