Download This statistics in other country:
Timeline:
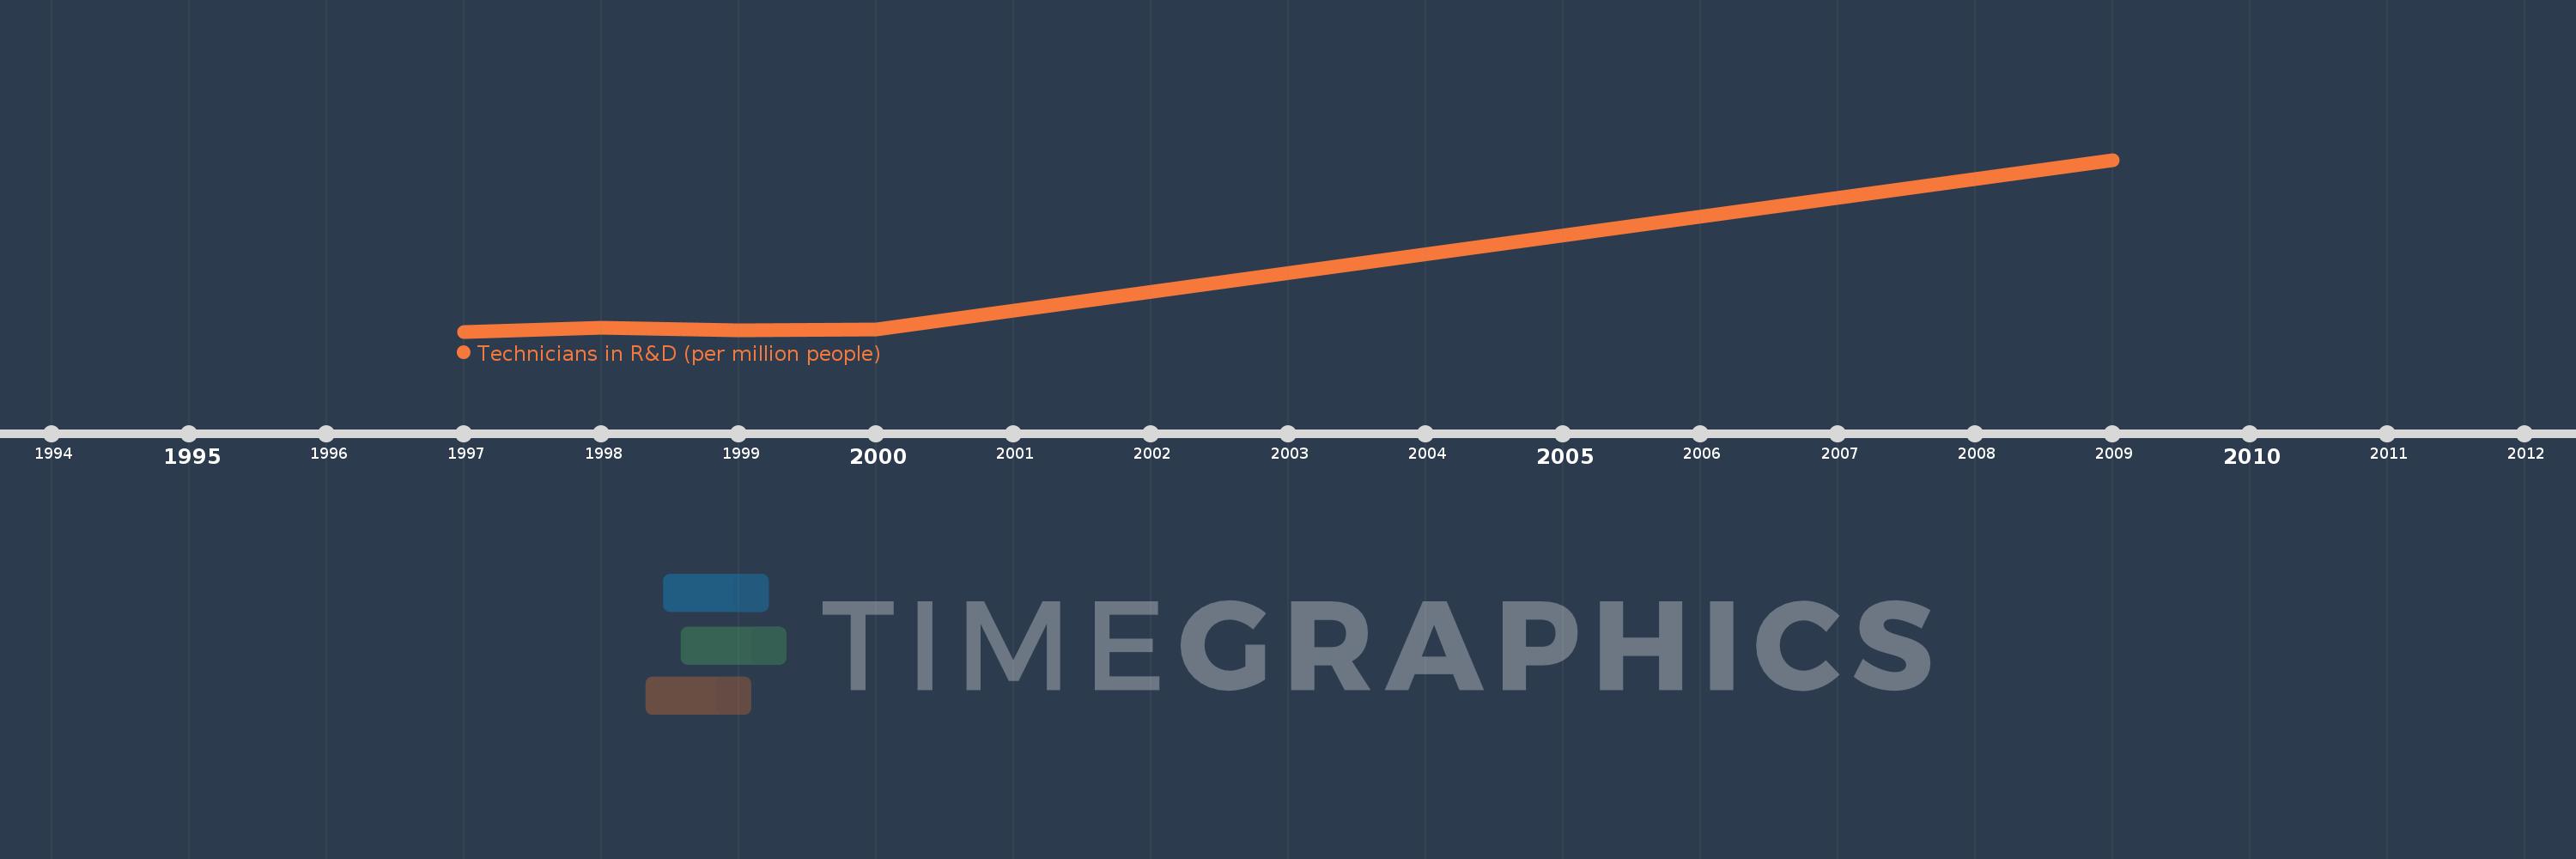
This timeline shows a graph from 1997 to 2009 of Zambia. No data until 1996. Number of actual observations by date: 5.
Source name:
World Development Indicators
Source organization:
United Nations Educational, Scientific, and Cultural Organization (UNESCO) Institute for Statistics.
Categories, topics:
Science & Technology
Last updated:
apr 23, 2017
Indicators value changes by year
Minimum:
15.154
jan 1, 1997
Maximum:
63.212
jan 1, 2009
At the date of observation
Value
Absolute change
Change from the previous value
jan 1, 1997
15.154
+15.154
0.0%
jan 1, 1998
16.182
+1.028
6.78%
jan 1, 1999
15.547
-0.636
-3.93%
jan 1, 2000
15.811
+0.264
1.7%
jan 1, 2009
63.212
+47.401
299.8%
Ranking of countries by current statistics by years