Download This statistics in other country:
Timeline:
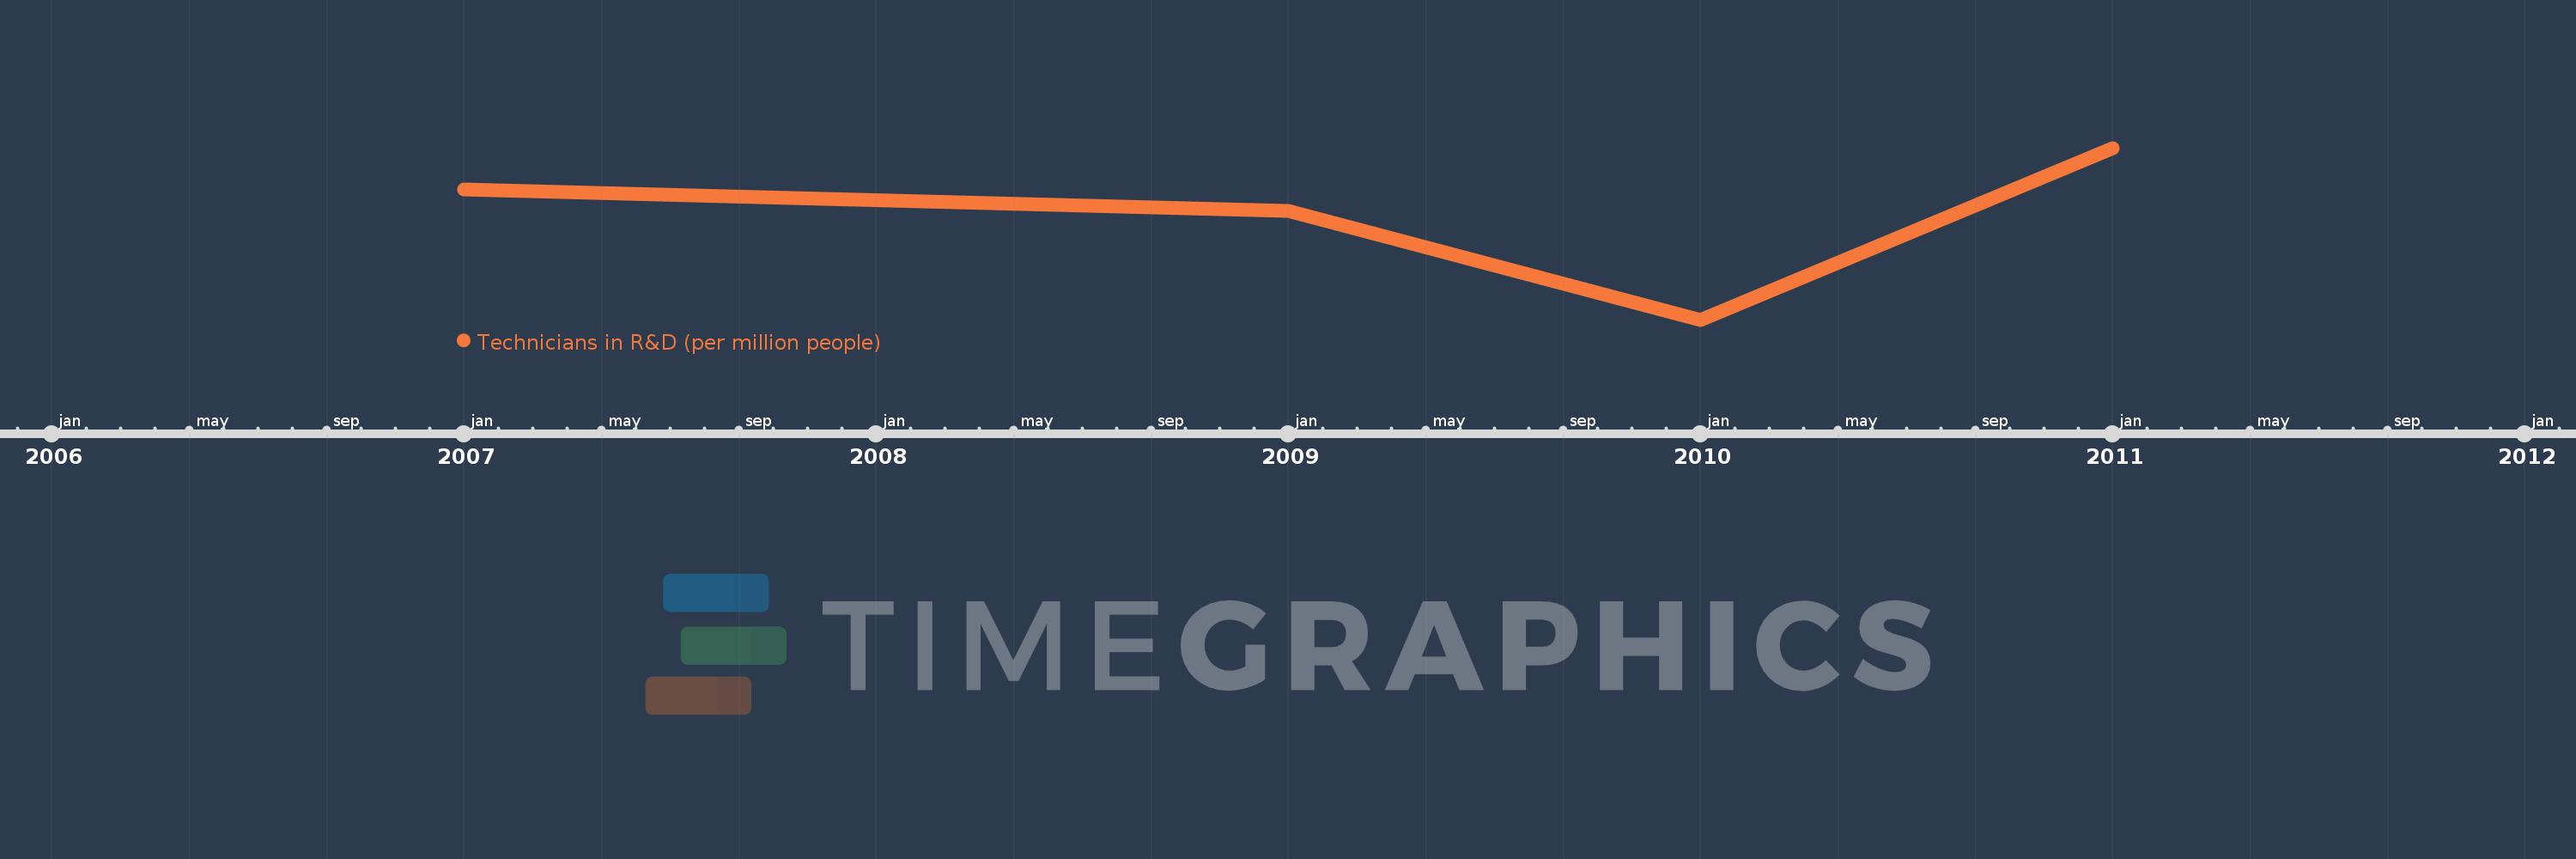
This timeline shows a graph from 2007 to 2011 of Mozambique. No data until 2006. Number of actual observations by date: 4.
Source name:
World Development Indicators
Source organization:
United Nations Educational, Scientific, and Cultural Organization (UNESCO) Institute for Statistics.
Categories, topics:
Science & Technology
Last updated:
apr 23, 2017
Indicators value changes by year
Maximum:
44.934
jan 1, 2011
At the date of observation
Value
Absolute change
Change from the previous value
jan 1, 2007
34.64
+34.64
0.0%
jan 1, 2009
29.276
-5.364
-15.48%
jan 1, 2010
2.006
-27.27
-93.15%
jan 1, 2011
44.934
+42.928
2.14K%
Ranking of countries by current statistics by years