Download This statistics in other country:
Timeline:
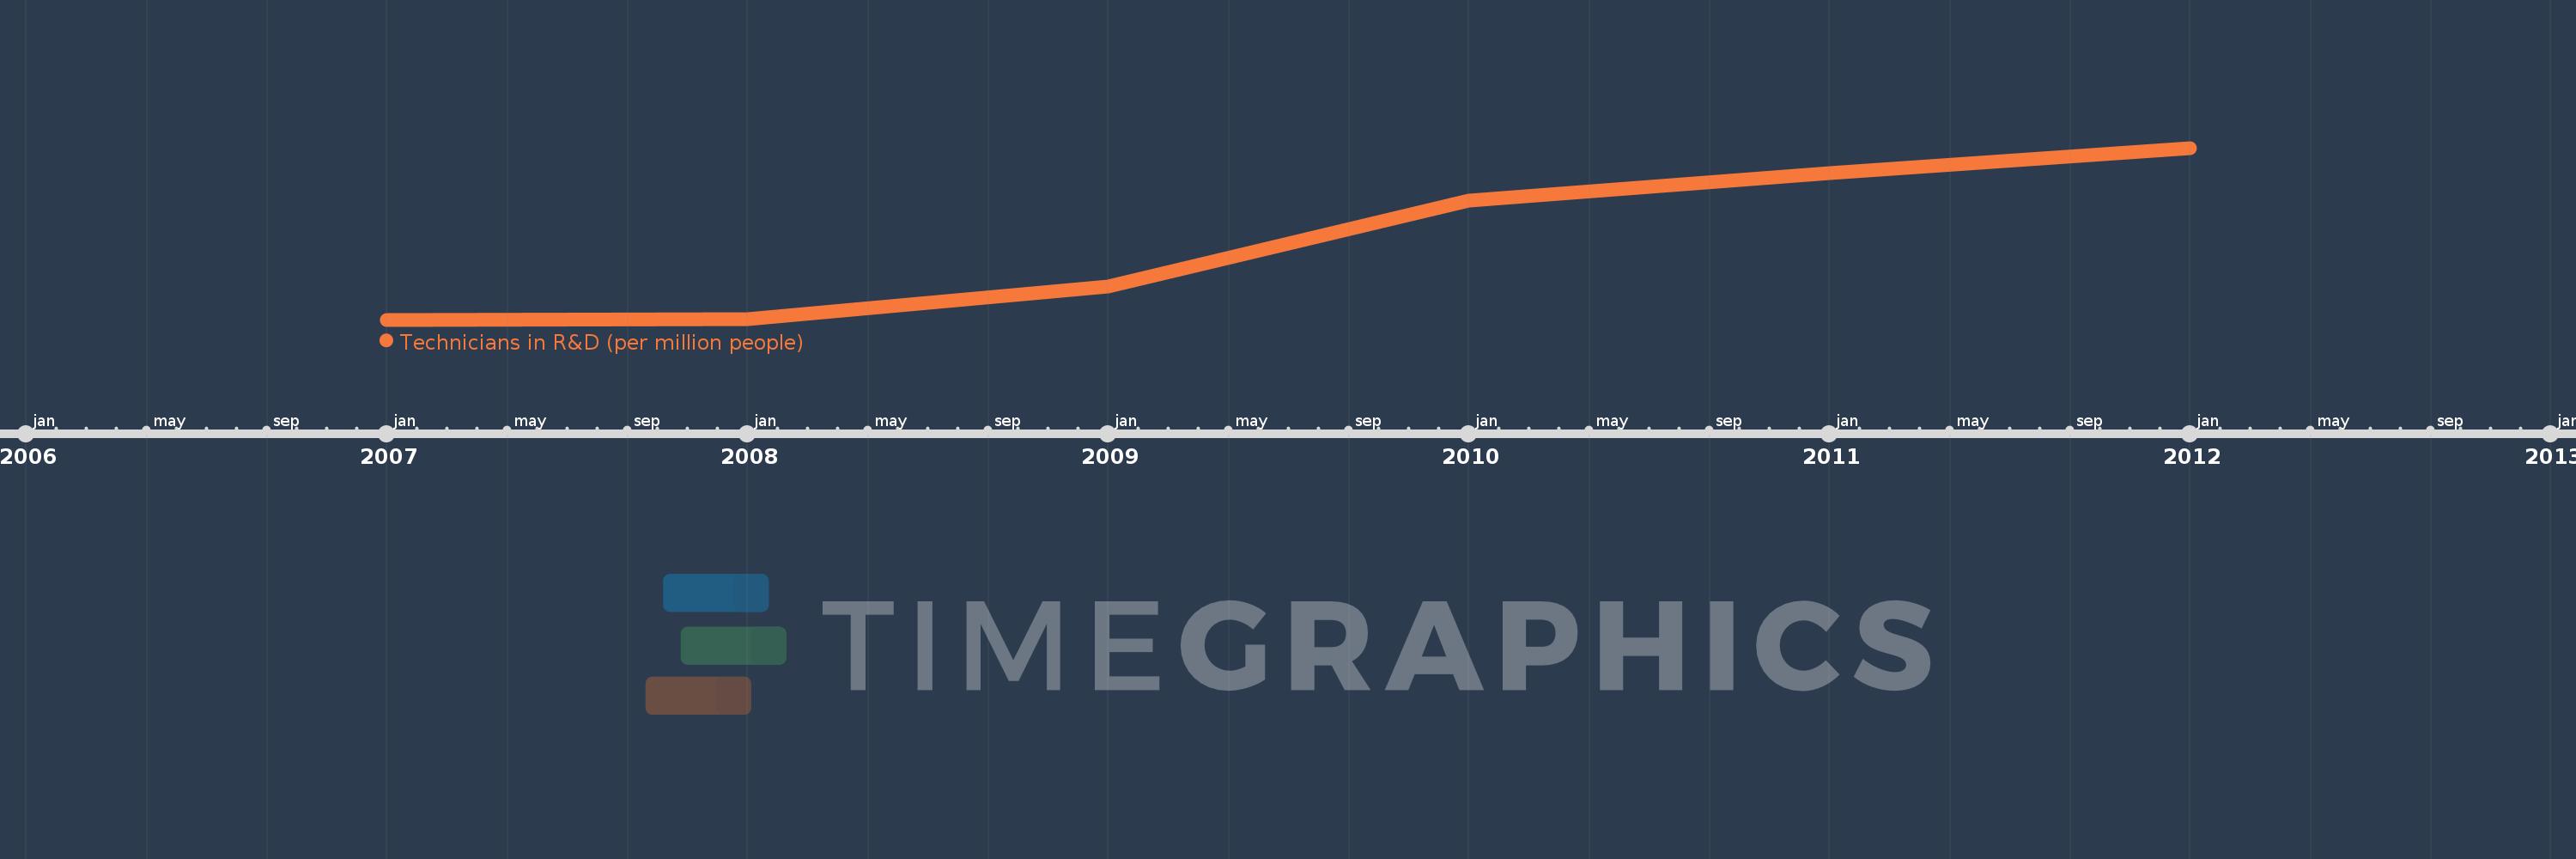
This timeline shows a graph from 2007 to 2012 of Ecuador. No data until 2006. Number of actual observations by date: 6.
Source name:
World Development Indicators
Source organization:
United Nations Educational, Scientific, and Cultural Organization (UNESCO) Institute for Statistics.
Categories, topics:
Science & Technology
Last updated:
apr 23, 2017
Indicators value changes by year
Minimum:
18.829
jan 1, 2007
At the date of observation
Value
Absolute change
Change from the previous value
jan 1, 2007
18.829
+18.829
0.0%
jan 1, 2008
18.936
+0.107
0.57%
jan 1, 2009
30.053
+11.117
58.71%
jan 1, 2010
59.438
+29.384
97.77%
jan 1, 2011
68.907
+9.469
15.93%
jan 1, 2012
77.54
+8.632
12.53%
Ranking of countries by current statistics by years