Download This statistics in other country:
Timeline:
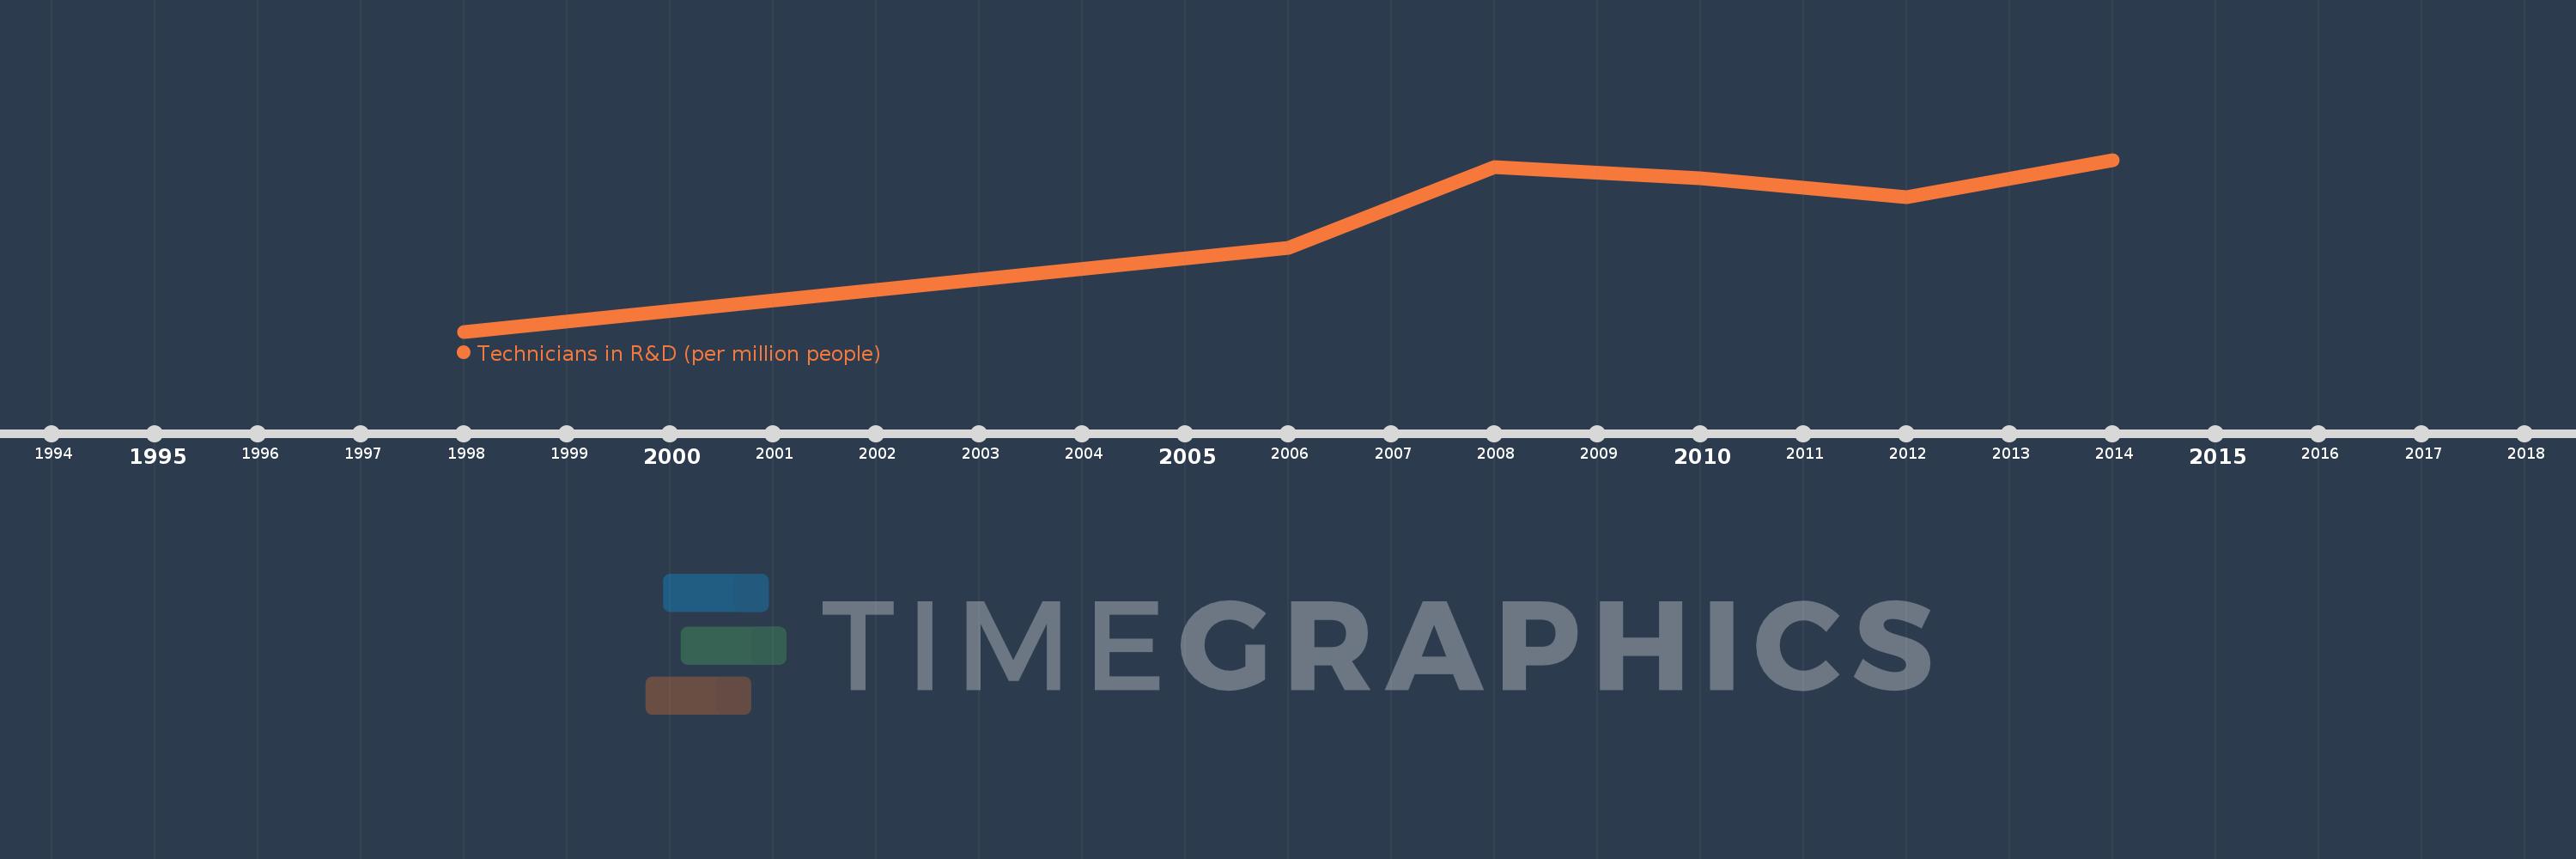
This timeline shows a graph from 1998 to 2014 of Pakistan. No data until 1997. Number of actual observations by date: 6.
Source name:
World Development Indicators
Source organization:
United Nations Educational, Scientific, and Cultural Organization (UNESCO) Institute for Statistics.
Categories, topics:
Science & Technology
Last updated:
apr 23, 2017
Indicators value changes by year
Minimum:
13.574
jan 1, 1998
Maximum:
72.183
jan 1, 2014
At the date of observation
Value
Absolute change
Change from the previous value
jan 1, 1998
13.574
+13.574
0.0%
jan 1, 2006
42.196
+28.621
210.85%
jan 1, 2008
69.557
+27.361
64.84%
jan 1, 2010
66.016
-3.542
-5.09%
jan 1, 2012
59.331
-6.685
-10.13%
jan 1, 2014
72.183
+12.852
21.66%
Ranking of countries by current statistics by years