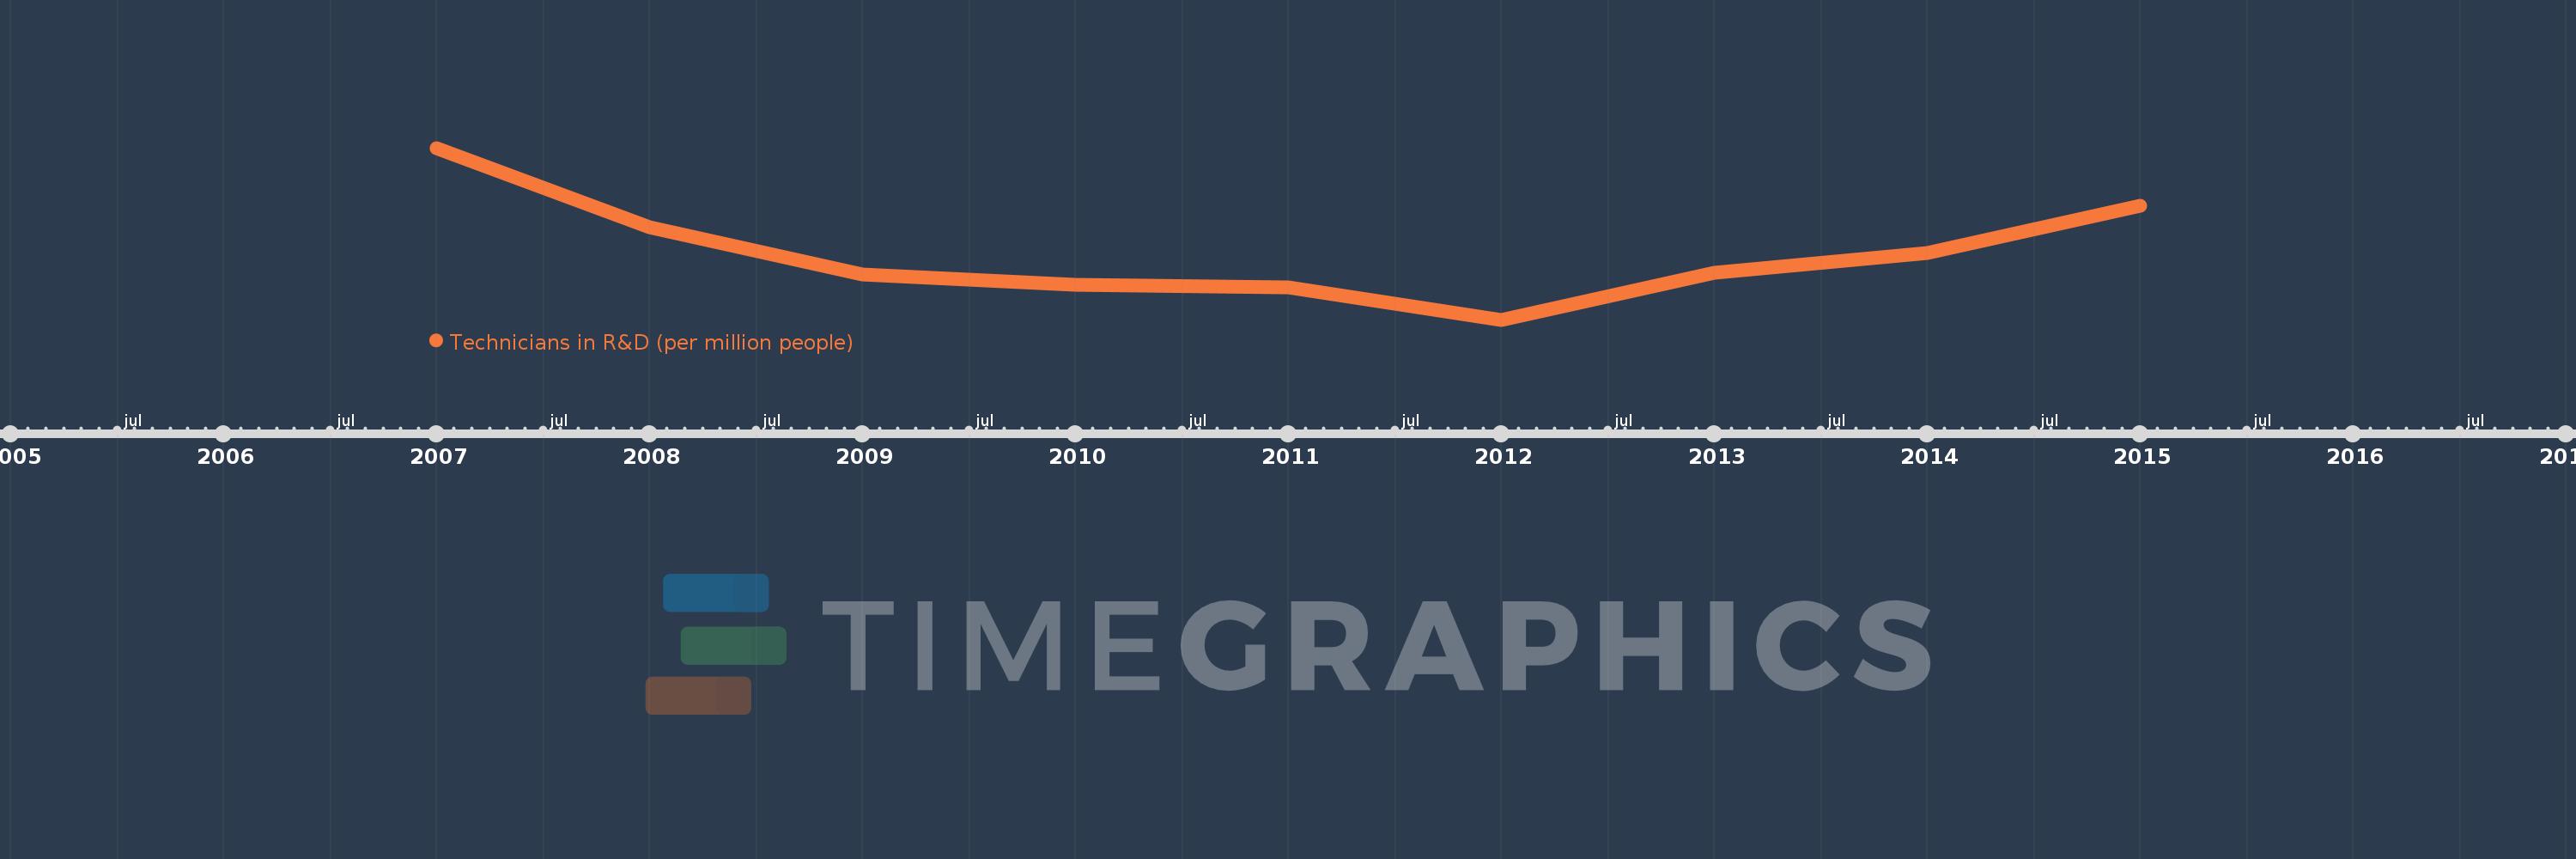
This timeline shows a graph from 2007 to 2015 of Europe & Central Asia (excluding high income). No data until 2006. Number of actual observations by date: 9.
Source name:
World Development Indicators
Source organization:
United Nations Educational, Scientific, and Cultural Organization (UNESCO) Institute for Statistics.
Categories, topics:
Science & Technology
Last updated:
apr 23, 2017
Indicators value changes by year
Meaning:
327.129
Minimum:
308.891
jan 1, 2012
Maximum:
355.47
jan 1, 2007
At the date of observation
Value
Absolute change
Change from the previous value
jan 1, 2007
355.47
+355.47
0.0%
jan 1, 2008
333.896
-21.574
-6.07%
jan 1, 2009
321.072
-12.824
-3.84%
jan 1, 2010
318.484
-2.588
-0.81%
jan 1, 2011
317.767
-0.718
-0.23%
jan 1, 2012
308.891
-8.875
-2.79%
jan 1, 2013
321.715
+12.824
4.15%
jan 1, 2014
326.973
+5.258
1.63%
jan 1, 2015
339.887
+12.914
3.95%
Ranking of countries by current statistics by years