Download This statistics in other country:
Timeline:
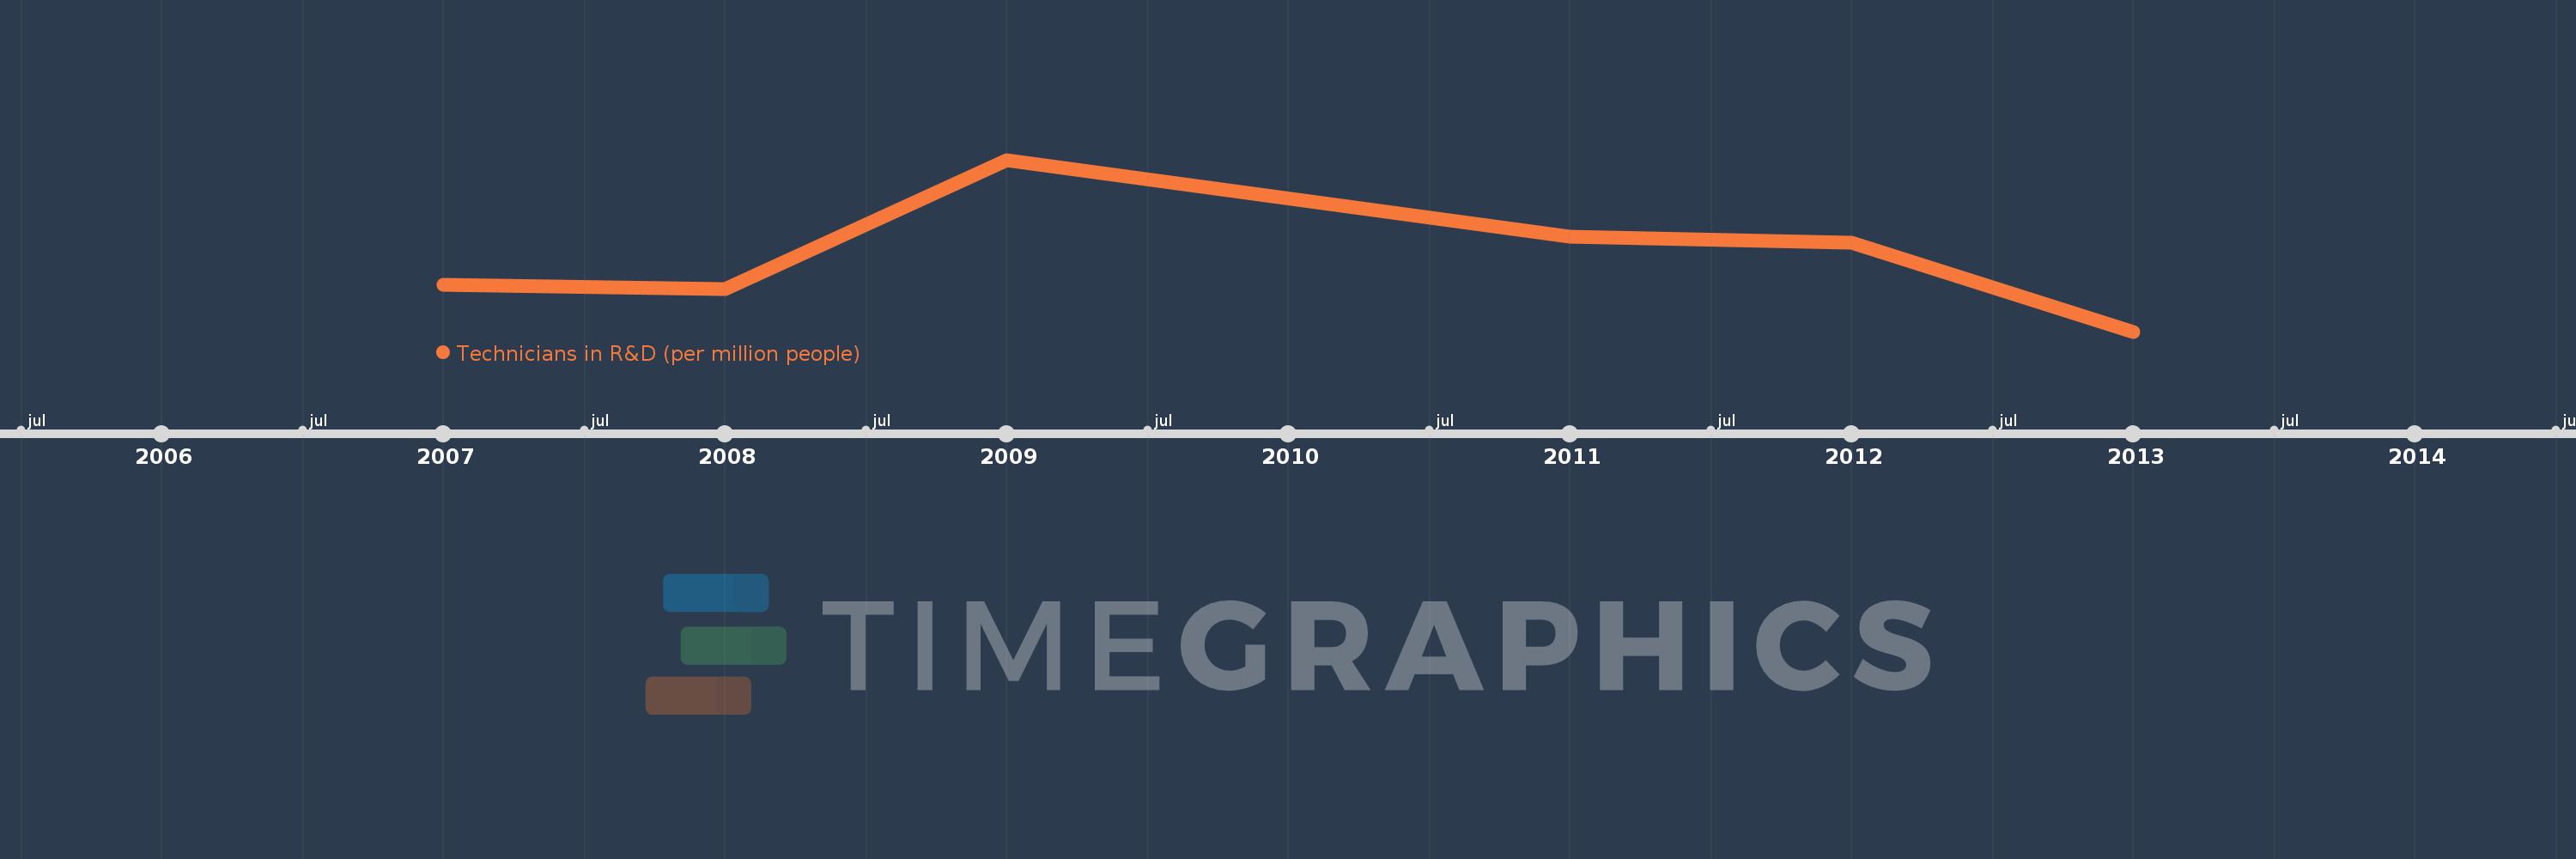
This timeline shows a graph from 2007 to 2013 of Morocco. No data until 2006. Number of actual observations by date: 6.
Source name:
World Development Indicators
Source organization:
United Nations Educational, Scientific, and Cultural Organization (UNESCO) Institute for Statistics.
Categories, topics:
Science & Technology
Last updated:
apr 23, 2017
Indicators value changes by year
Minimum:
42.869
jan 1, 2013
Maximum:
60.892
jan 1, 2009
At the date of observation
Value
Absolute change
Change from the previous value
jan 1, 2007
47.798
+47.798
0.0%
jan 1, 2008
47.305
-0.493
-1.03%
jan 1, 2009
60.892
+13.587
28.72%
jan 1, 2011
52.853
-8.039
-13.2%
jan 1, 2012
52.164
-0.689
-1.3%
jan 1, 2013
42.869
-9.295
-17.82%
Ranking of countries by current statistics by years