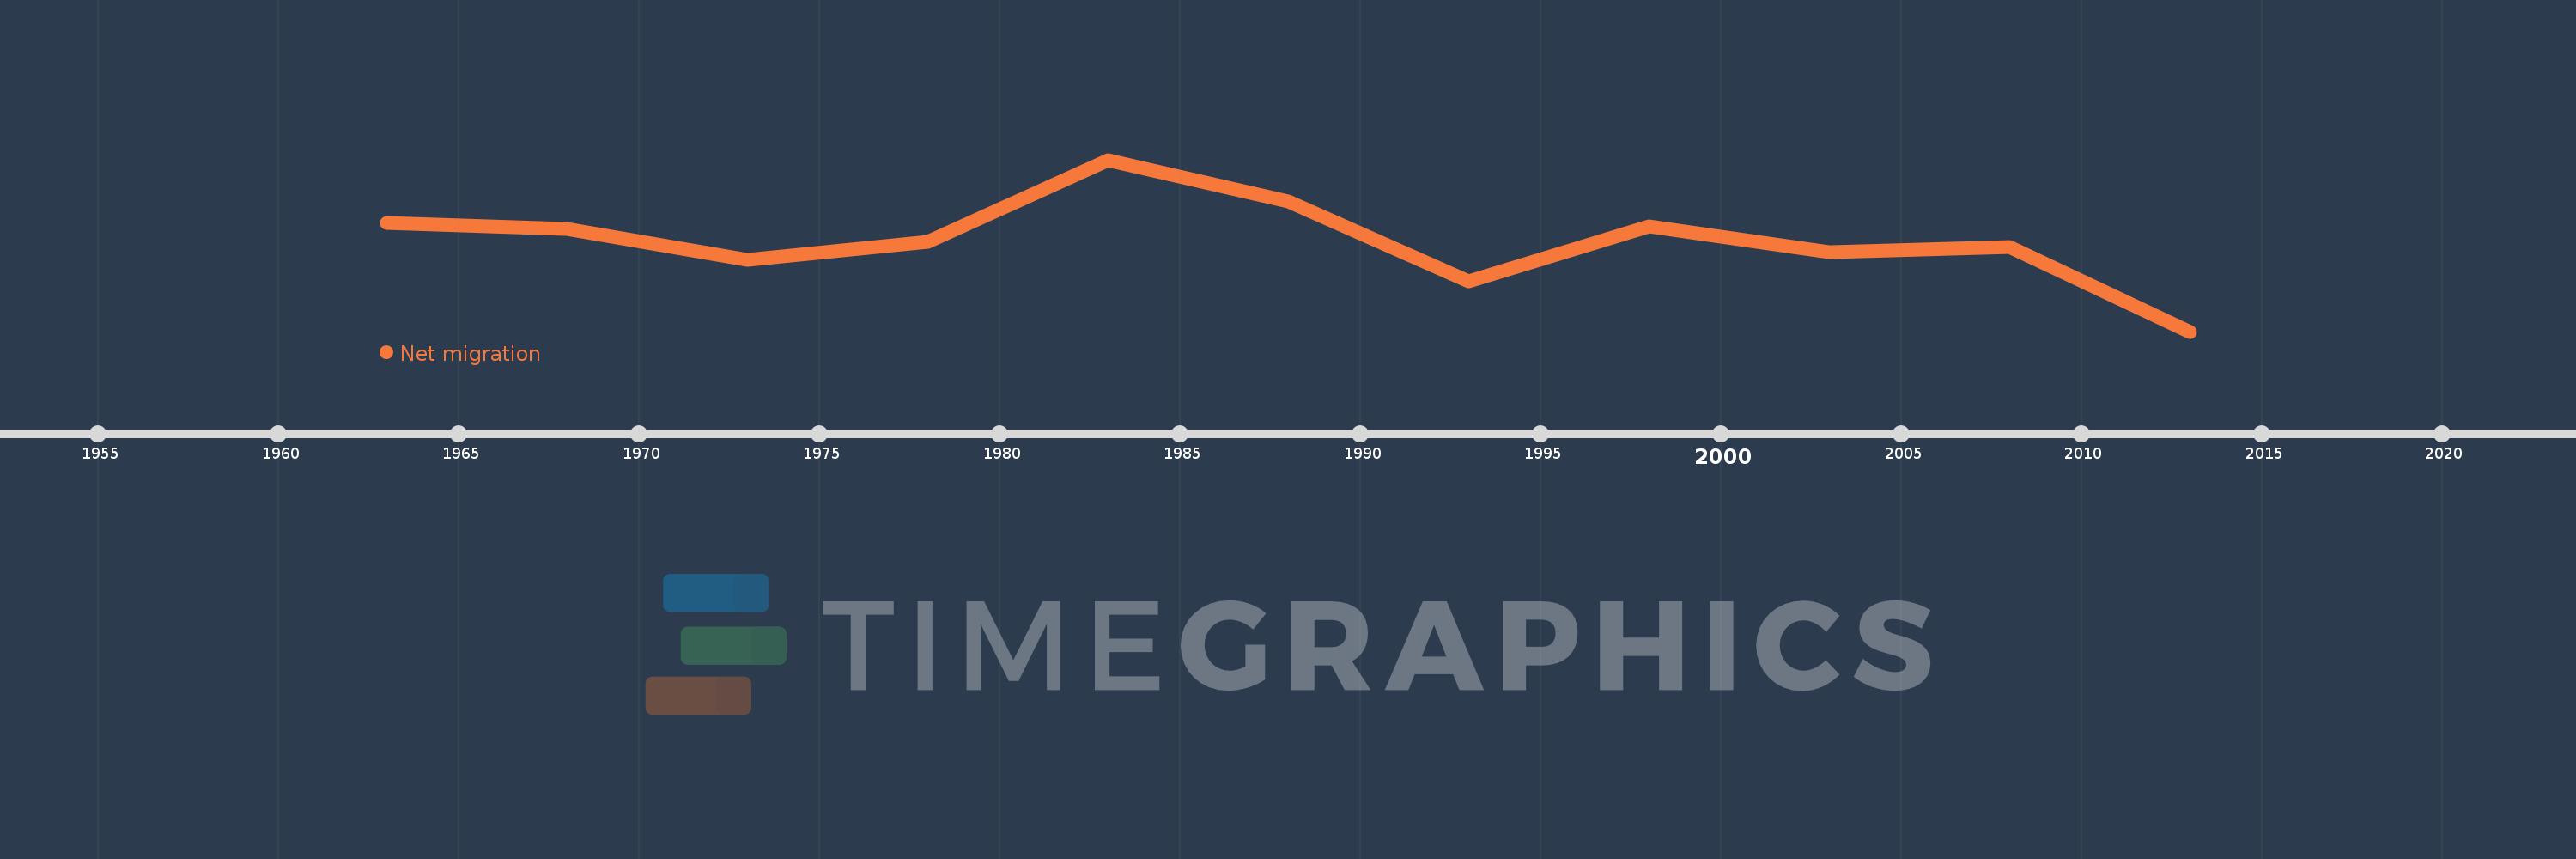
This timeline shows a graph from 1963 to 2013 of Middle East & North Africa (IDA & IBRD countries). No data until 1962. Number of actual observations by date: 11.
Source name:
World Development Indicators
Source organization:
United Nations Population Division, World Population Prospects.
Categories, topics:
Financial Sector, Health, Aid Effectiveness
Last updated:
apr 23, 2017
Indicators value changes by year
Meaning:
-1.208 mln
Minimum:
-3.572 mln
jan 1, 2013
Maximum:
917.257K
jan 1, 1983
At the date of observation
Value
Absolute change
Change from the previous value
jan 1, 1963
-723.877K
-723.877K
0.0%
jan 1, 1968
-894.743K
-170.866K
23.6%
jan 1, 1973
-1.701 mln
-806.116K
90.09%
jan 1, 1978
-1.22 mln
+480.563K
-28.25%
jan 1, 1983
917.257K
+2.138 mln
-175.17%
jan 1, 1988
-164.968K
-1.082 mln
-117.98%
jan 1, 1993
-2.254 mln
-2.089 mln
1.27K%
jan 1, 1998
-822.761K
+1.432 mln
-63.5%
jan 1, 2003
-1.497 mln
-674.195K
81.94%
jan 1, 2008
-1.353 mln
+144.332K
-9.64%
jan 1, 2013
-3.572 mln
-2.219 mln
164.07%
Ranking of countries by current statistics by years